Figure 1.
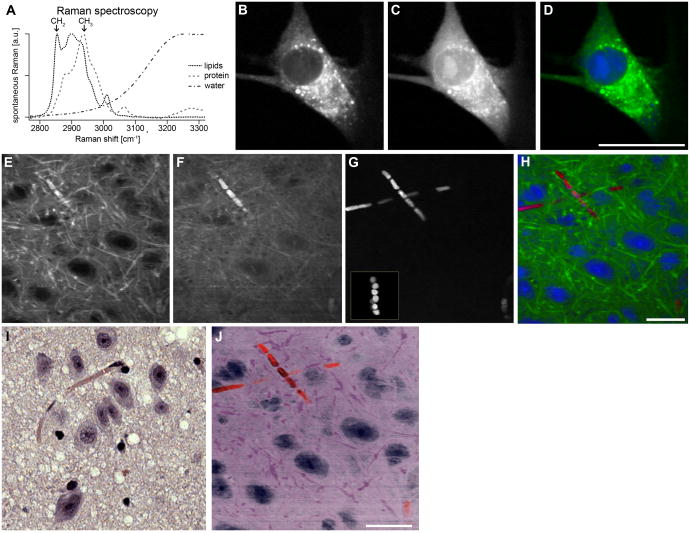
Stain-free histologic imaging with multi-color CRI. (A) Vibrational spectra of the major constituents of tissue: lipids, protein and water. Arrows indicate Raman shifts at which imaging is performed. (B-D) SRS images of a live C2C12 mammalian cell acquired at the CH2-stretching vibration at 2845cm-1(B) and CH3-stretching vibration at 2940cm-1 (C). Multicolor image (D) generated from images (B) and (C) with the green channel (CH2 image) showing the cell-body and the blue channel (thresholded CH3-CH2 difference image) highlighting the nuclear morphology including a bright nucleolus. (E-H) SRS images of fresh ex vivo brain tissue acquired at CH2-stretching vibration at 2845cm-1 (E), CH3-stretching vibration at 2940cm-1 (F), and vibrationally off-resonant showing TPA of hemoglobin at a sum frequency of 23,700 cm-1 (G). Multicolor image (H) generated from images (E-G) with the green channel (CH2 image) highlighting cytoplasm and myelin sheaths, blue channel (thresholded CH3-CH2 difference image) showing the nuclear morphology, and the red channel (hemoglobin image) highlighting red blood cells. (I) H&E-stained micrograph from the same region in the brain. (J) Same multicolor image as (H) with a different pseudo-color scheme, chosen to mimic the appearance of an H&E-stained micrograph, illustrates the similar image content and appearance of stain-free images and H&E stained sections. Scale bar, 25 μm.

