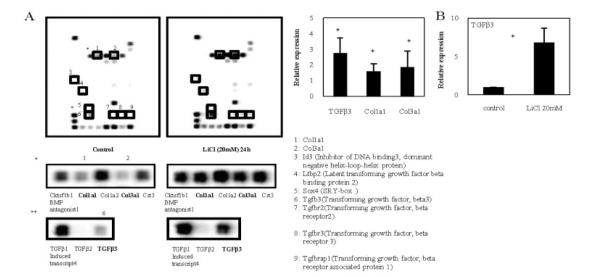
Figure 6.
A, Profiling of genes regulated by transforming growth factor β (TGFβ)/bone morphogenetic protein (BMP) signaling in nucleus pulposus (NP) cells. Representative Oligo GEArray profiling results are shown. The intensity of several spots was up-regulated or down-regulated after 24 hours of treatment of NP cells with LiCl (20 mM) (right) as compared with controls (left). Regions containing Col1a1, Col3a1, and TGFβ3 are shown at higher magnification in the middle and bottom panels, and demonstrate that the intensity of these spots was markedly increased in the LiCl-treated cells. Band intensities were quantified by densitometry and normalized to control (without treatment) gene levels using CS Analyzer software (version 2.01; Atto). Spots of interest are numbered in the control array and are enclosed in boxes in both the control and the LiCl treatment arrays; the numbers are defined at bottom right. B, Relative expression of TGFβ3, Col1a1, and Col3a1 (left) and TGFβ3 following LiCl treatment (right) in NP cells, as determined by real-time polymerase chain reaction analysis. Levels of TGFβ3, Col1a1, Col3a1, and GAPDH expression were quantified and normalized to the expression in untreated cells, which was arbitrarily set at 1.0. TGFβ3 gene expression was significantly increased after 24 hours of treatment of NP cells with LiCl (20 mM), with 6.8-fold higher levels than in untreated control cells. Values are the mean and SD. * = P < 0.05 versus control.

