
Figure 3. The effect of miR-24 silencing on LCC-RyR communications.
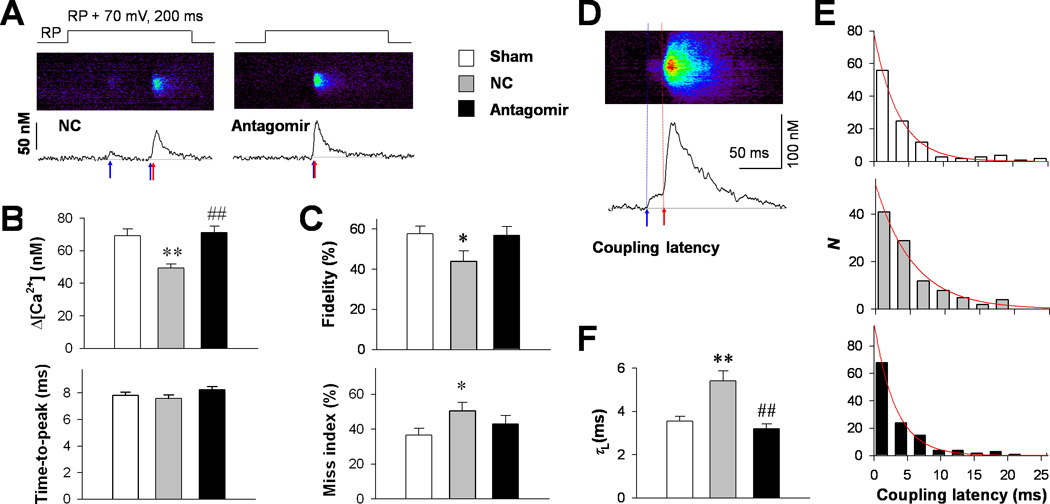
A, Representative loose-patch confocal images (middle) and their time profiles (lower) in NC and antagomir groups, showing that LCC Ca2+ sparklets (blue arrows) triggered RyR Ca2+ sparks (red arrows) in a probabilistic manner during 70-mV depolarizations from resting potential (RP+70, upper). B, Amplitude (upper) and time-to-peak (lower) of triggered Ca2+ sparks in sham (187 events), NC (150 events) and antagomir (185 events) groups. C, LCC-RyR coupling fidelity (upper) was indexed by the percentage of the first apparent Ca2+ sparklet that successfully activated a Ca2+ spark during a patch depolarization. The miss index (lower) was defined as the percentage of depolarizing pulses that failed to trigger any Ca2+ spark. The percentages were first determined for each cell, and then averaged in the sham (59 cells), NC (52 cells) and antagomir (62 cells) groups. D, Example of a confocal image (upper) and its time profile (lower) from the antagomir group, illustrating the measurement of LCC-RyR coupling latency from the onset of a Ca2+ sparklet (blue arrow) to the takeoff of the triggered Ca2+ spark (red arrow). E, The distributions (bars) and their exponential fits (curves) of coupling latency in sham (109 events), NC (105 events) and antagomir (123 events) groups. F, Comparison of time constants (τL) of the LCC-RyR coupling latency among groups. *P <0.05 and **P <0.01 vs. sham; ##P <0.01 vs. NC.