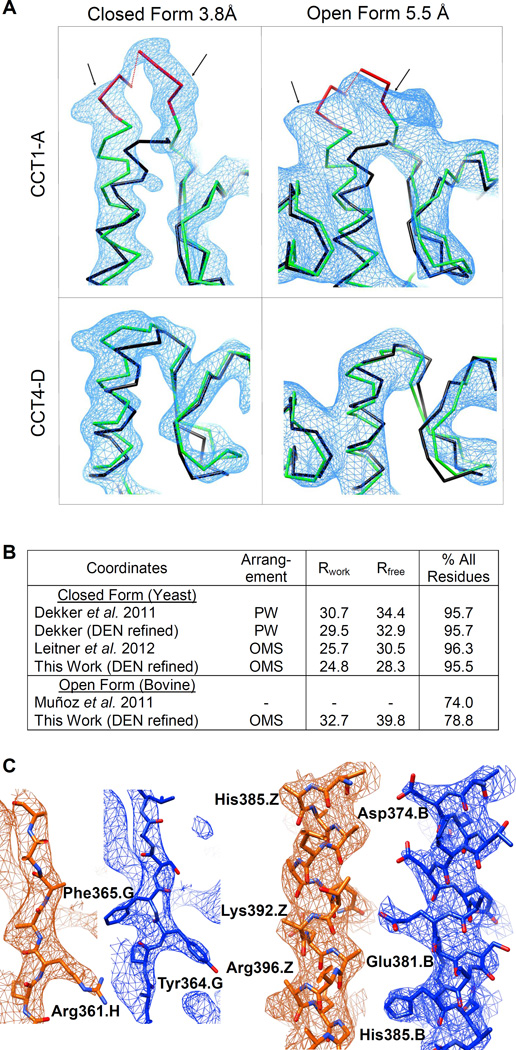
Figure 2. Refined X-ray structures.
(A) An insertion (red) unique to the sequence of the CCT1-A subunit is well resolved as an additional density (delineated by arrows) in both the closed and open datasets. Such density is not observed in the adjacent CCT4-D subunit. Overlaid for scale on the CCT traces (green) is the backbone from the archaeal 1Q3R chaperonin template (black). Density is contoured at 2σ and 1σ for the closed and open forms, respectively. See also Fig. S2.
(B) Refinement summaries for this work and for previous models of the same datasets. The PW subunit arrangement of the particle is that of Dekker et al. (2011), while the OMS arrangement (Kalisman et al., 2012) is as determined here. Over 60% of the side chains in PW are in the wrong sequence alignment position, yet the Rfree is the same as for Leitner et al. (2012).
(C) Snapshots at identical positions in the unit cell show that our model (blue) fits the m2Fo-DFc electron density map better than the model of Dekker et al. (orange). The quality of the density is also improved, showing side-chains more clearly. Maps for both models are averaged over the four rings in the asymmetric unit and contoured at 2σ. Phases are calculated from the published coordinates.

