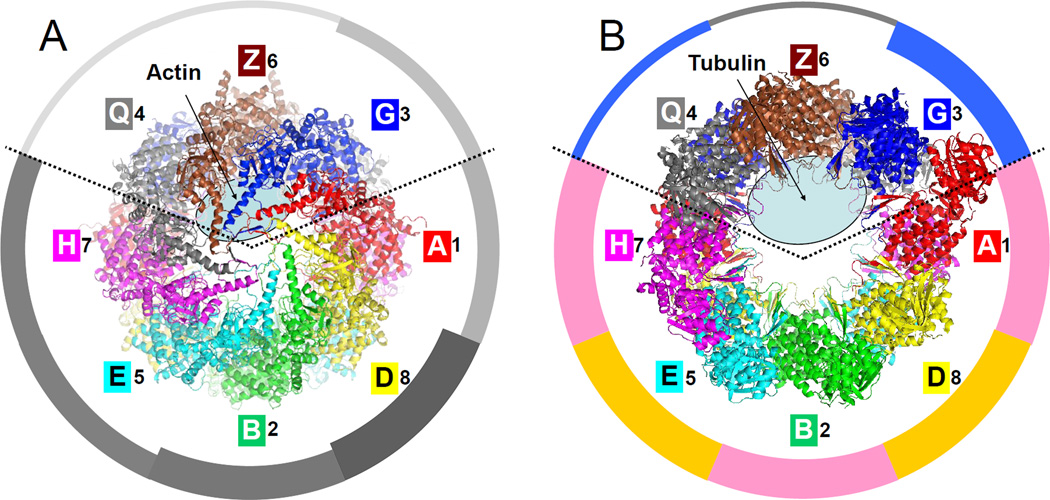
Figure 5. Substrate binding and ATP hydrolysis are partitioned in the CCT particle.
(A) Top view of the closed form with the location of residual actin density (Dekker et al., 2011) marked with an ellipse. The ATP hydrolysis potency of individual subunits (Amit et al., 2010; Methods) is proportional to width in the surrounding pie-chart.
(B) Top view of the open form with the location of residual tubulin density (Muñoz et al., 2011) marked with an ellipse. The average sequence identity of each subunit to all the others is proportional to width in the pie-chart (see also Fig. 6); groups of closest sequences are colored pink (A-1, B-2, H-7) and ochre (D-4, E-5). A ring partitioning emerges: subunits 3-G, 6-Z and 8-Q are involved in substrate binding while the other subunits are involved in ATP hydrolysis.

