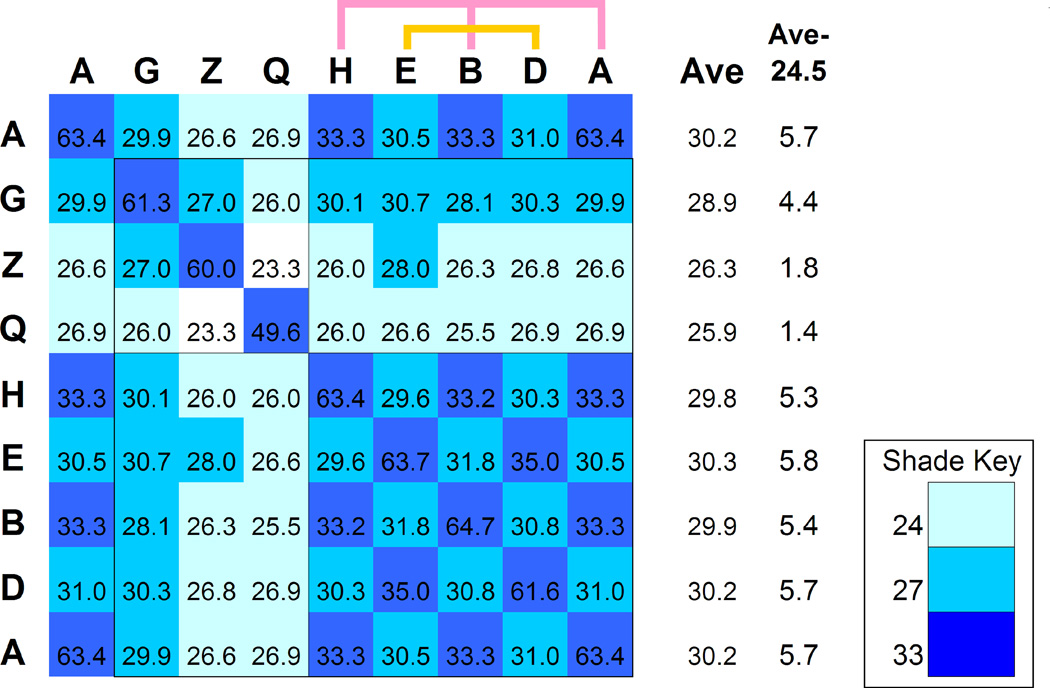
Figure 6. Sequence identity among subunit types.
The sequence identity between the CCT subunit types was calculated using a multiple sequence alignment of 13 species. The value shown for each subunit pair is the average percent identity of all the pairwise comparisons across species. The values are shaded to emphasize the closest subunit types: with 33% identity or more in dark blue, 27% or more in cyan and 24% or more in light blue. The average off-diagonal values are given in column “Ave” and indicate how close each subunit type is to all others. The modified value in column “Ave-24.5” is used to set the width of the pie-chart segments in Fig. 5B. Subunits that are close to one another can be arranged in two sets (A, B, H) and (D, E). Subunit CCT8-Q is significantly less conserved across species.

