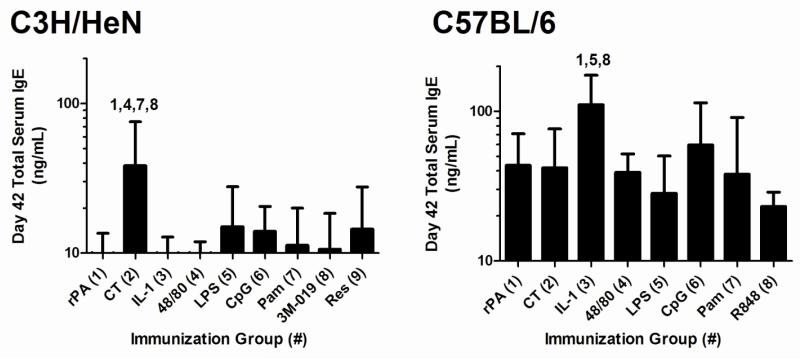
Figure 2. Total serum IgE after nasal immunization with rPA formulated with non-toxin adjuvants.
Mice were immunized as described in Figure 1. Total IgE was measured in day 42 serum. Bars represent mean ± standard deviation Statistical analysis was performed using one-way ANOVA and Tukey’s multiple comparison test. The numbers above the error bars indicate which groups (1-9) are significantly different from the indicated group.

