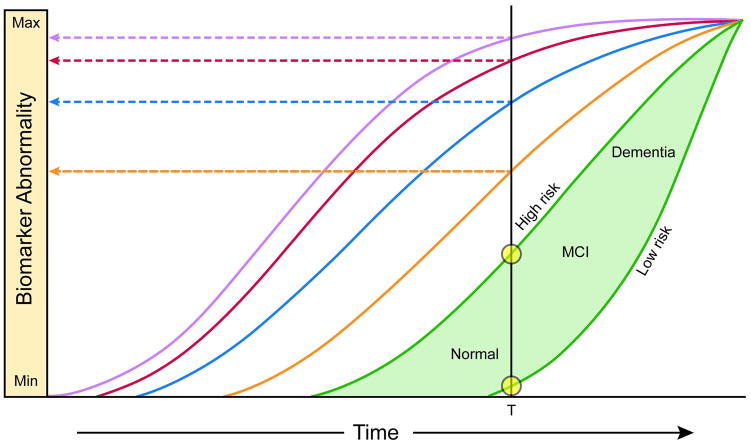
Figure 6. Model integrating AD immuno-hisotology and biomarkers.
The threshold for biomarker detection of pathophysiology is denoted by a horizontal line. The grey area denotes the zone in which abnormal pathophysiology lies below the biomarker detection threshold. In this illustration, tau pathology precedes Aβ amyloid deposition in time – but early on exists at a subthreshold biomarker detection level. Aβ amyloid deposition then occurs independently and rises above biomarker threshold detection (purple and red arrows). This induces acceleration of tauopathy with CSF tau then rising above threshold level (blue arrow). Later still, FDG PET and MRI (orange arrow) rise above threshold detection level. Finally, cognitive impairment becomes evident (green arrow), with a range of cognitive responses that depend on the individual’s risk profile (green filled area).

