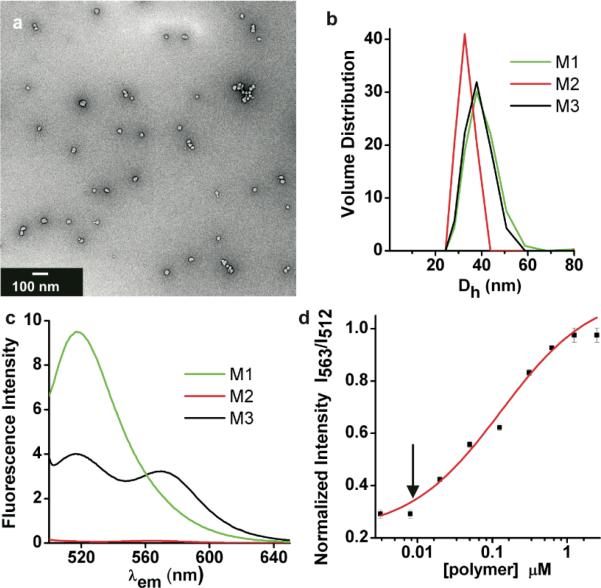
Fig. 2.
TEM, DLS and fluorescence spectroscopy of fluorogenic micelles. a) TEM of 30 nm M3. b) DLS of M1, M2 and M3 showing hydrodynamic diameters (Dh) in the range of 30-40 nm. c) Fluorescence emission spectra of M1, M2 and FRET-micelle, M3 upon excitation at 470 nm. d) Ratio of normalized emission intensity for maxima at 563 nm (rhodamine) and 512 nm (fluorescein) over a range of concentrations of PPA-1 and PPA-2 upon excitation at 470 nm. Arrow indicates onset of detectable FRET.

