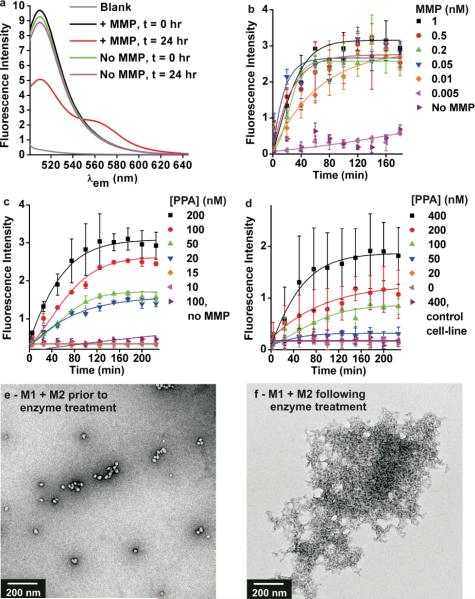
Fig. 4.
Response of mixtures of M1 and M2 to MMPs. a) Fluorescence spectra of M1 and M2 (0.5 μM each with respect to PPA) with and without MMP-9 (10 nM) at times indicated following enzyme addition; λex = 470. b-d) Fluorescence intensity vs time plots via plate reader analysis, to monitor rearrangement of PPA-1 and PPA-2 into new FRET active aggregates; λex = 490 and λem = 590 nm. b) Detection of MMP-9 down to 10 pM of enzyme with M1 and M2 (at 0.5 μM, [PPA]). c) Detection of MMP-9 at 10 nM with varying concentrations of M1 and M2 shown with respect to [PPA], detectable down to 20 nM of polymer. d) Detection of cell-secreted (WPE1-NA45 cells) MMP-2 and -9 with varying concentrations of M1 and M2 shown with respect to [PPA]. Cells were seeded at 1.6 × 10⁴ cells/well in a clear bottom 96-well plate in DMEM. After 24 hrs, cell medium was added to solutions of M1 and M2. MMP-2 and -9 were at 0.048 nM and 0.005 nM respectively as quantified by an ELISA assay (see Supporting Information) Control was the non-MMP expressing MCF-7 cell-line cultured in the same manner. All reactions run in PBS, unless otherwise noted. e-f) TEM of M1 and M2 before, and after 24 hrs following MMP-9 treatment.

