FIG. 2.

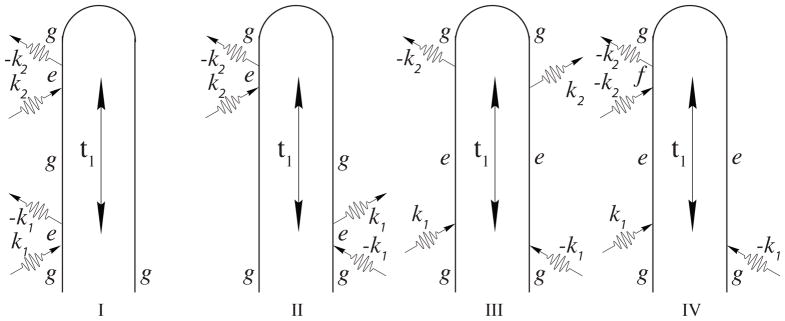
The four loop diagrams for the pump-probe experiment with well separated pulses. Diagrams I and II represent stimulated resonance Raman (SRR), III is excited state stimulated emission (ESE), and IV is excited-state absorption (ESA).

The four loop diagrams for the pump-probe experiment with well separated pulses. Diagrams I and II represent stimulated resonance Raman (SRR), III is excited state stimulated emission (ESE), and IV is excited-state absorption (ESA).