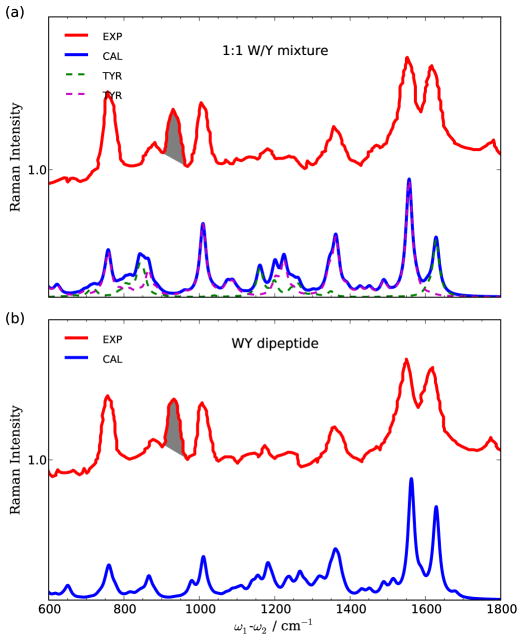
FIG. 6.
Comparison between experimental (red) and calculated (blue) spontaneous resonance Raman spectra of (a) 1:1 tyrosine/tryptophan mixture and (b) WY dipeptide excited at 225 nm (44444 cm−1). Experimental data taken from Ref.[31]. Contributions from solvent modes are shaded in the experimental spectra. The calculated spectra of 1:1 mixture is obtained by summing the spectra of tyrosine (green dashed) and tryptophan (magenta dashed). The shaded peaks at 932 cm−1 come from internal standard.

