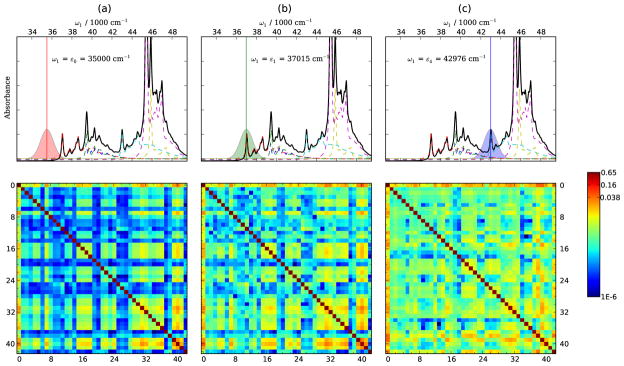
FIG. 9.

Modulus of transition polarizability matrices (Eq. 14) for (a) ε0 35500 cm−1, (b) ε1:Trp-Lb 37015 cm−1, and (c) ε4:Tyr-La 42976 cm−1. Pulses and the absorption spectra are shown on top. Axes of the matrices are labeled by the vibrational modes as listed in Table II, ν0 is the ground vibrational state. Log scale function ᾱ = log(α) is used for better visibility.
