
Figure 5. PK and PD profiles of rILYd4.
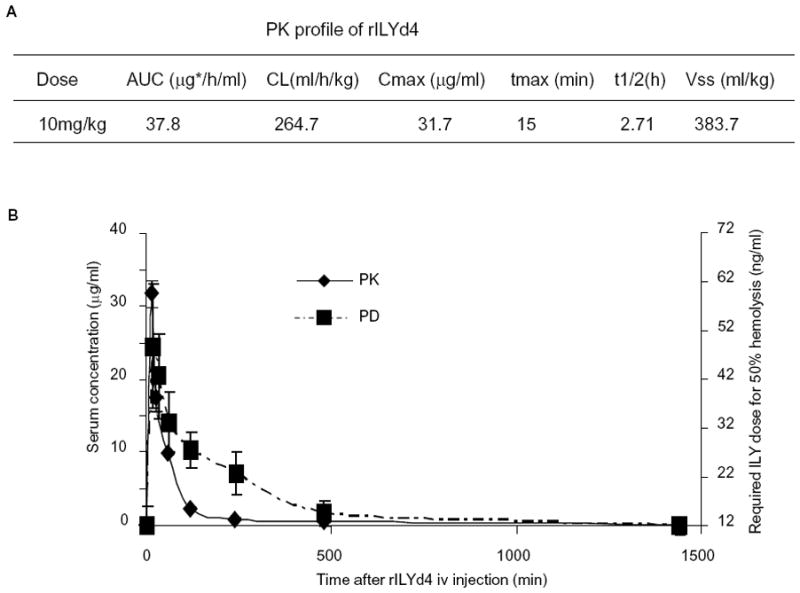
(A) PK profile of rILYd4. AUC: Area under the curve, CL: clearance, Cmax: maximum concentration of a compound in blood, Tmax: time at which Cmax is reached, t1/2: time required for the concentration of a compound in blood or plasma to decrease by 50%, and Vss: distribution volume. (B) Correlation between the PK and PD profile of rILYd4. The data represents as mean ± s.e.m.