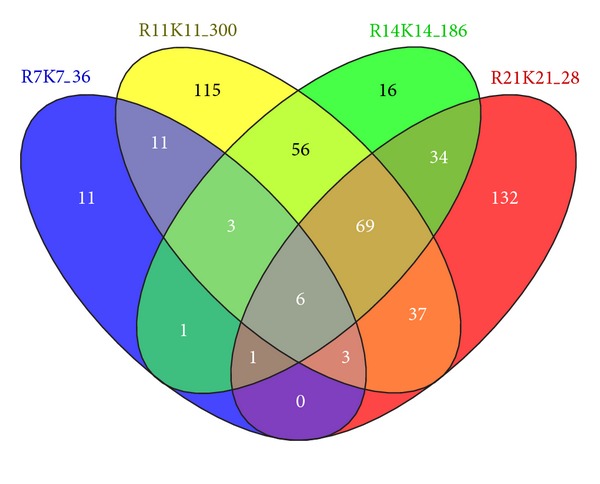
Figure 2.

Venn diagram of four DE sets having the number of DE genes between two different healing systems detected by Fisher's exact test with FDR 0.05 at each time point (t = 7,11,14, and 21 days). Four time points were compared in simple pairwise comparison between two biological conditions, R (delayed healing) versus K (standard healing system). The label of each set depicts the number of DE genes in the specific comparison. The majority of interaction sets of DE genes between two successive time points implies that high proportion in detected differentially expressed genes at current stage tends to be redetected at next stage revealed by inherent time-dependent structure in time series gene expression profile.
