
Figure 4.
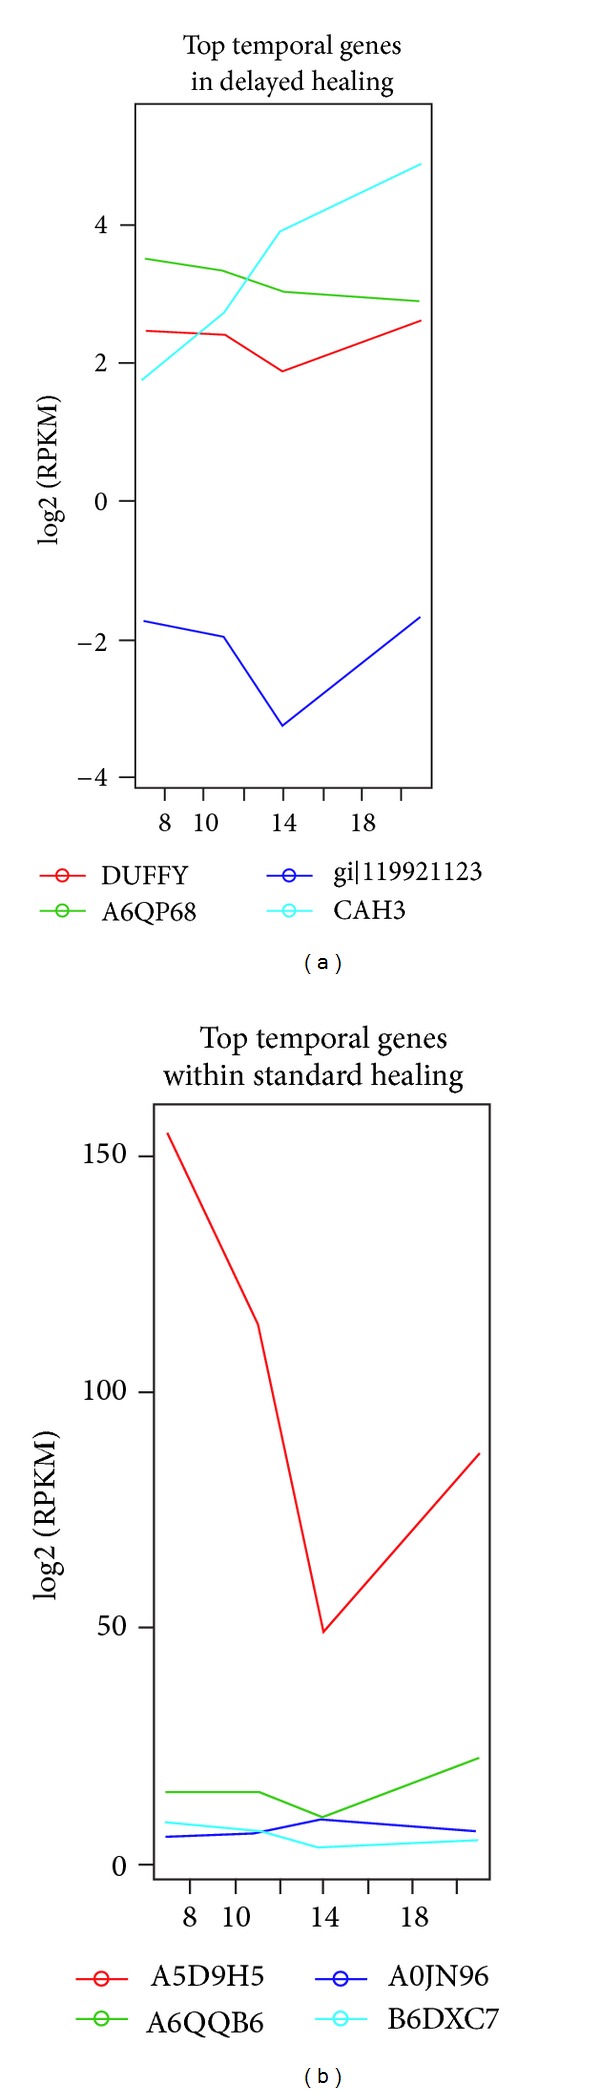
Top candidate temporally differentially expressed genes identified by statistical evolutionary trajectory index (SETI) within each healing system in a sheep model data. Each panel depicts temporal patterns between log2 (normalized expression levels, RPKM) and four different time points under their expression curves. The distinct colors represent significant individual genes ranked by SETI and FDR 0.05 by resampling procedures.