
Figure 6.
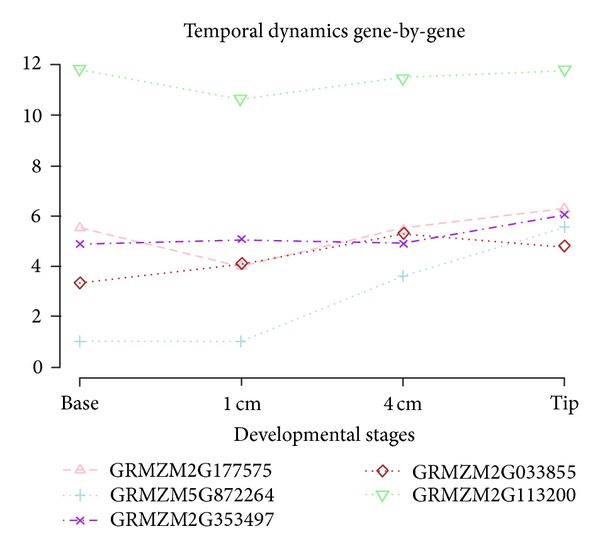
Gene expression curves for five significant TDE genes in maize leaf data. Mean expression curves are presented from two replicates during four developmental stages comparing temporal patterns each other in identifying statistically significant trajectories.