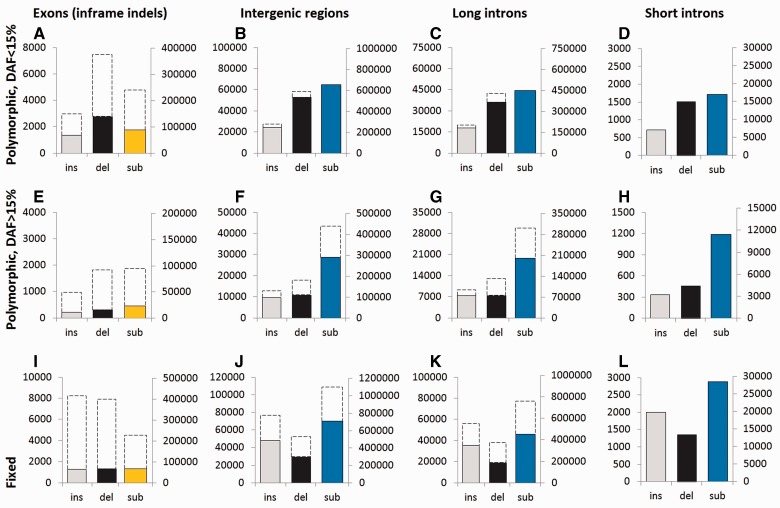
Fig. 2.—
Numbers of polymorphic and fixed indels and single-nucleotide substitutions in genome compartments of different kinds. Top row (A–D), polymorphisms with DAF < 15%; middle row (E–H), polymorphisms with DAF > 15%; and bottom row (I–L), fixed mutations. A, E, I: exons (inframe indels and missense substitutions); B, F, J: intergenic regions; C, G, K: long (>300 nt) introns; and D, H, L: short (70–300 nt) introns. Light gray, insertions; dark gray, deletions; yellow, amino acid substitutions; and blue, single-nucleotide substitutions in noncoding regions. Broken lines show the expected values if polymorphism and the rate of divergence in the compartment were the same as in the short introns. In each panel, the left vertical axis shows the number of indels, and the right vertical axis shows the number of single-nucleotide substitutions.

