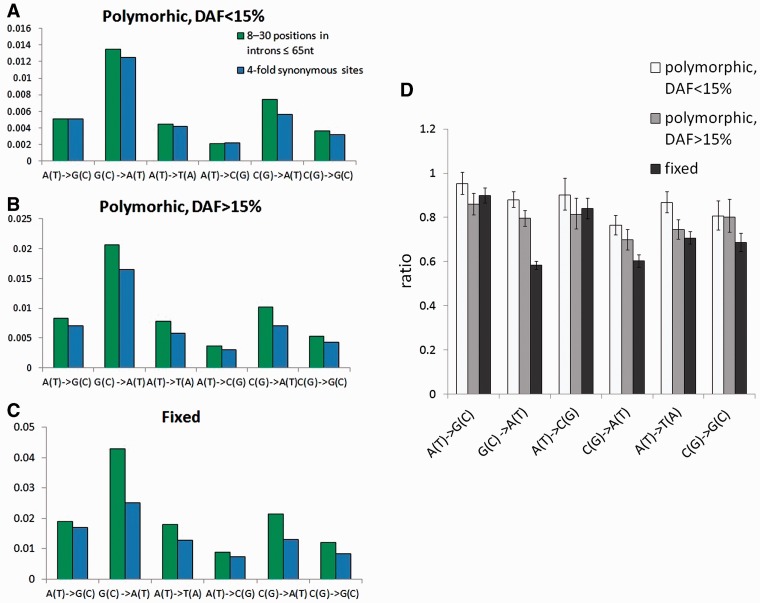
Fig. 5.—
Negative selection on synonymous sites. Panels A–C show the numbers of single-nucleotide substitutions per nucleotide site. Green bars correspond to mutations within 8–30 nt in introns ≤65 nt, and blue bars correspond to mutations within the 4-fold-degenerate sites. (A) polymorphisms with DAF<15%; (B) polymorphisms with DAF>15%; and (C) fixed mutations. In panel D, each bar is the ratio of the per-site numbers of single-nucleotide substitutions observed within the 4-fold-degenerate sites and in positions 8–30 of short introns. Error bars are 95% confidence intervals based on 1,000 bootstrap trials.

