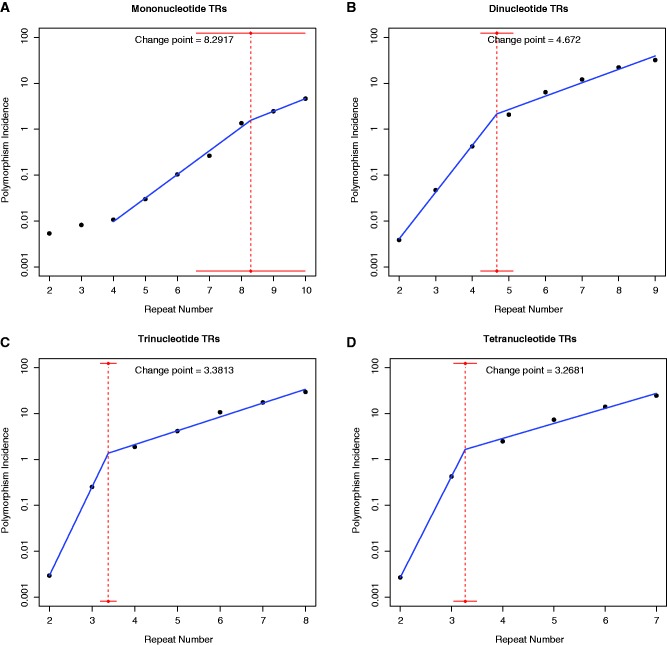
Fig. 2.—
European (CEU) population: log of polymorphism incidence (see also fig. 1, black symbols) against repeat number, with fits from segmented regression (blue), for (A) mono-, (B) di-, (C) tri-, and (D) tetranucleotide TRs. Dotted vertical red lines show the location of the change points. Horizontal red lines represent 90% confidence intervals for change points. For mononucleotides, values at repeat number 2 and 3 were not included in the segmented regression fit due to convergence issue (see Materials and Methods for details).

