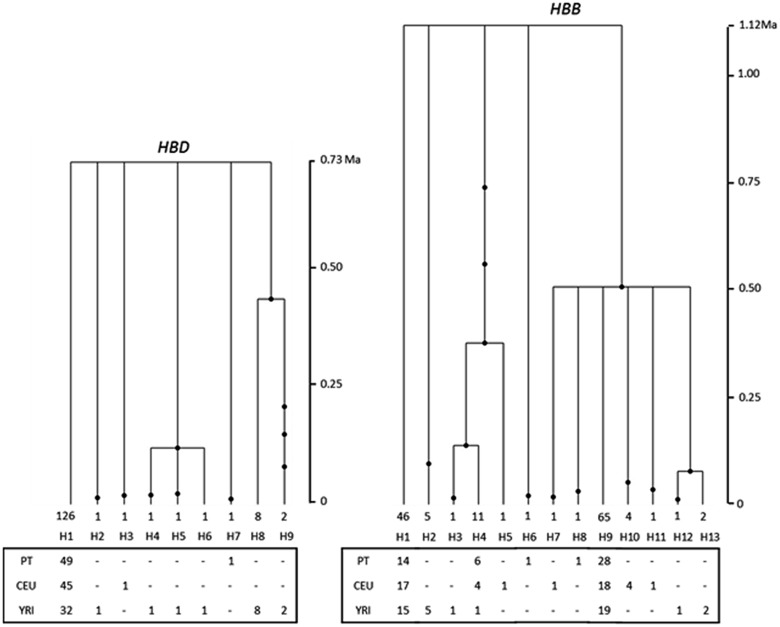
Fig. 2.—
HBD and HBB gene genealogies as estimated by Genetree. Time is scaled in millions of years (Myr). Solid circles represent nucleotide substitutions. The number below each branch of the trees represents the chromosomes observed for each haplotype, and in the lower diagram this information is split by population.

