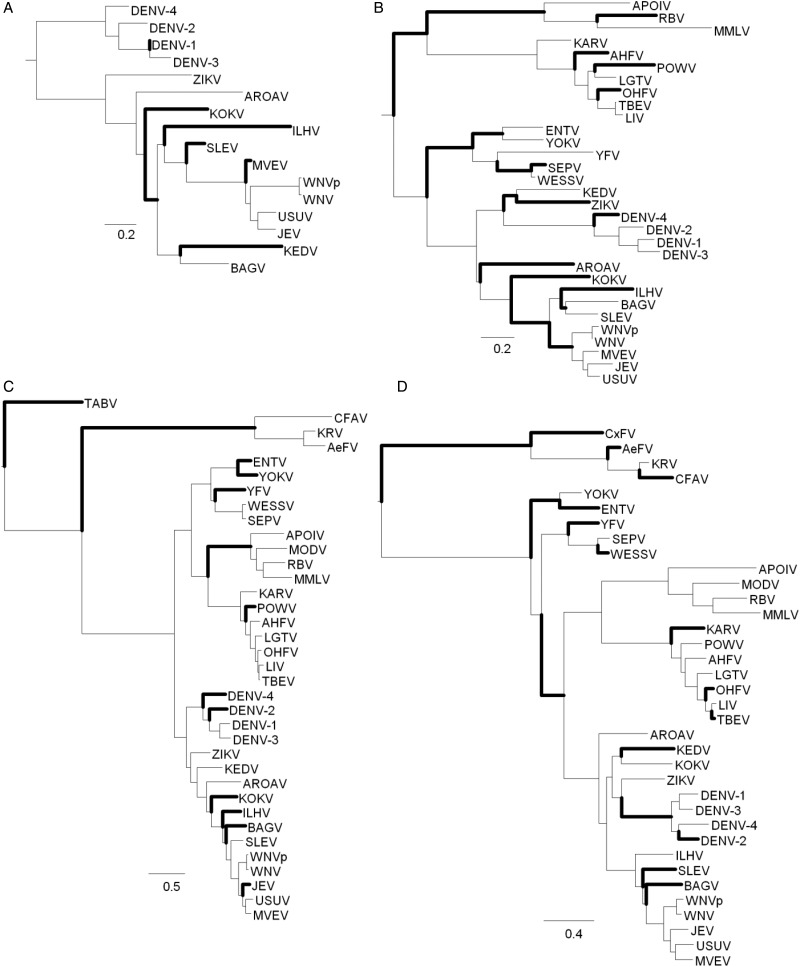
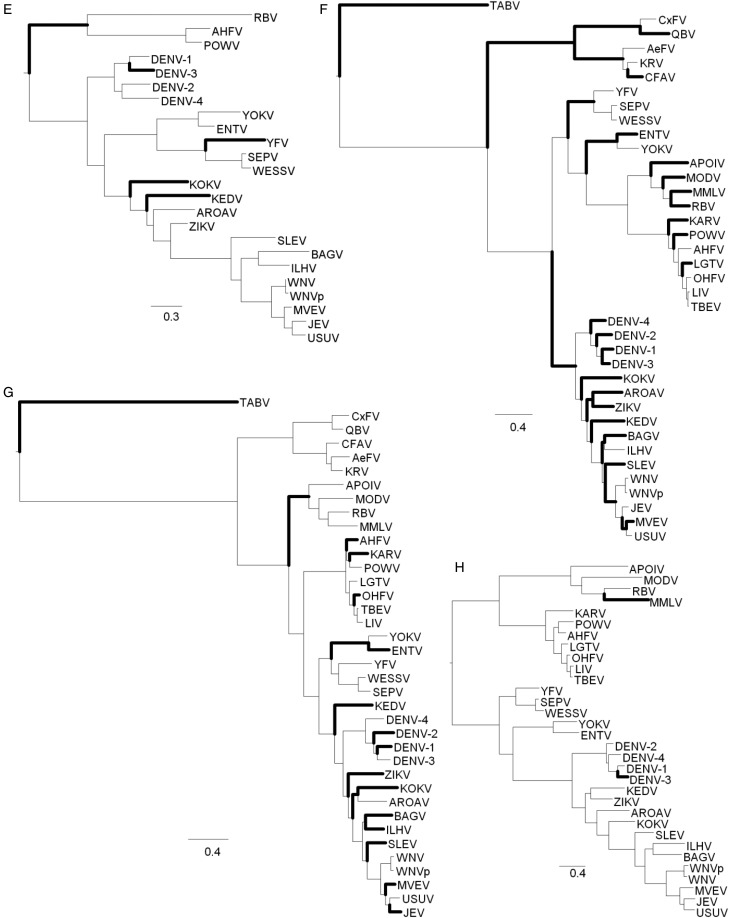
Fig. 4.—
Changes in disorder across branches. The result of the parsimony analysis of disorder to order transitions or vice versa over the phylogentic tree as changes per branch. Branches with more than 5% of sites in DOT are shown with wider lines: (A) capsid, (B) membrane glycoprotein precursor, (C) envelope, (D) NS1, (E) NS2B, (F) NS3, (G) NS5, and (H) NS4B. (For complete output, including NS2A, 2K, and NS4A, which have no branches with more than 5% of sites in DOT, see Supplementary fig. S2, Supplementary Material online.)


