
Fig. 1.—
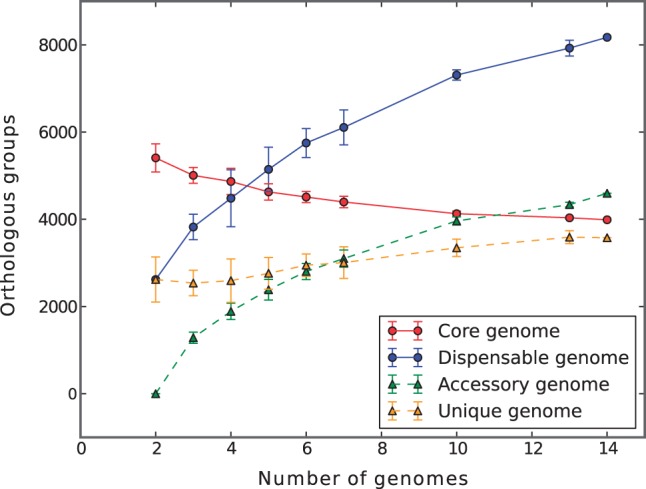
Sinorhizobium meliloti pangenome permutations statistics. Each point indicates the number of orthologs that are found in each pangenomic fraction. The trend lines on the median values are shown.
Official websites use .gov
A
.gov website belongs to an official
government organization in the United States.
Secure .gov websites use HTTPS
A lock (
) or https:// means you've safely
connected to the .gov website. Share sensitive
information only on official, secure websites.
Sinorhizobium meliloti pangenome permutations statistics. Each point indicates the number of orthologs that are found in each pangenomic fraction. The trend lines on the median values are shown.