
Fig. 7.—
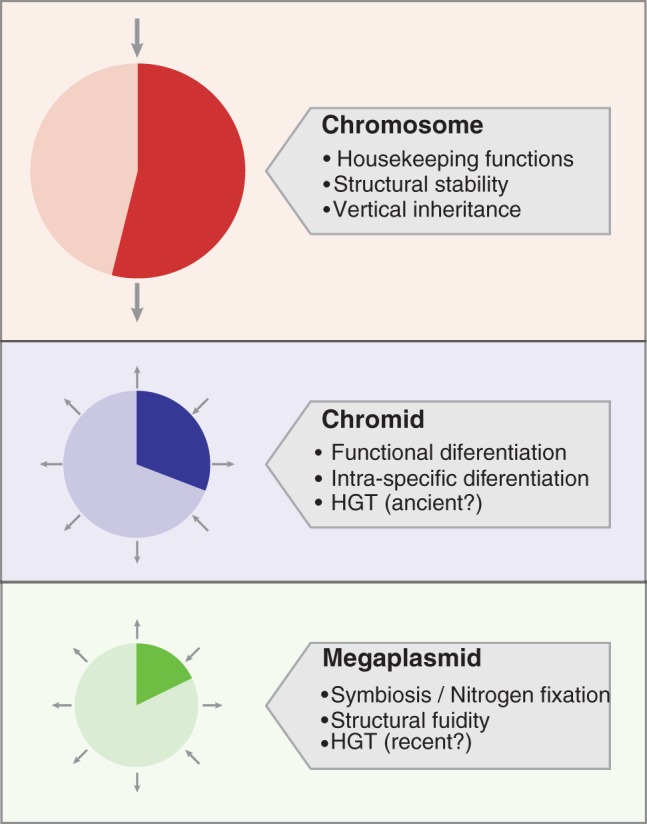
Tasks and evolutionary differences of replicons in S. meliloti. Pie charts indicate the proportion of each replicon that is present in the DNA backbones. The arrows indicate the transmission mechanism: vertical inheritance (two arrows) or HGT (radial arrows).