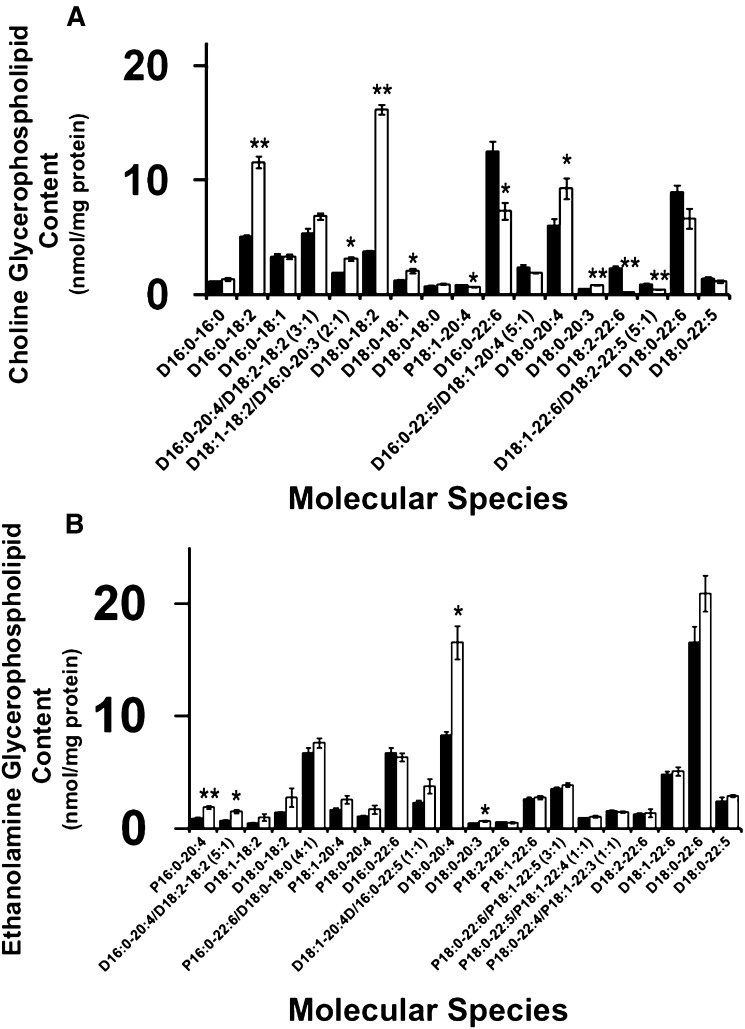
Fig. 2.
Quantitation of myocardial choline and ethanolamine glycerophospholipid molecular species in the Taz KD mouse model. A: Analysis of choline glycerophospholipid molecular species revealed a selective increase in 18:2- and a decrease in 22:6-enriched molecular species. B: Analysis of ethanolamine glycerophospholipids revealed an increase in specific 20:4-containing species. Values represent the mean quantitative value of molecular species ± S.E. (N = 3 hearts per group; black bars, wild-type littermates; white bars, Taz KD mice). Values lower than 0.5 nmol/mg protein were not presented for figure clarity. *P < 0.05 level, **P < 0.01 level.

