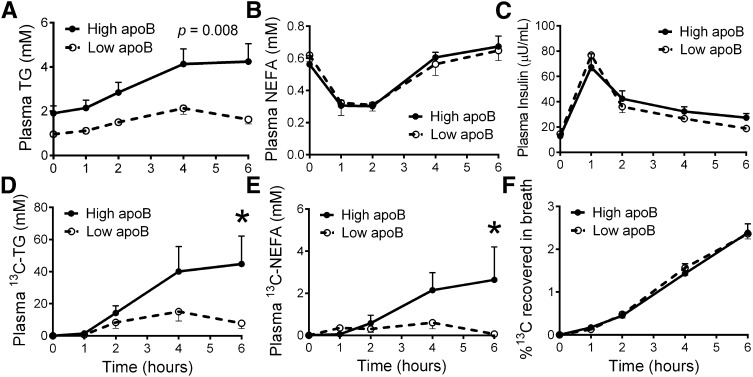
Fig. 1.
The postprandial changes in plasma TG (A), plasma NEFA (B), plasma insulin (C), plasma 13C-TG (D), plasma 13C-NEFA (E), and percentage of 13C-dose recovered in breath CO2 (F) following the ingestion of 13C-triolein-labeled high-fat meal in women with high and low plasma apoB (N = 11/group). Group differences were analyzed by repeated-measures two-way ANOVA, *P < 0.01.

