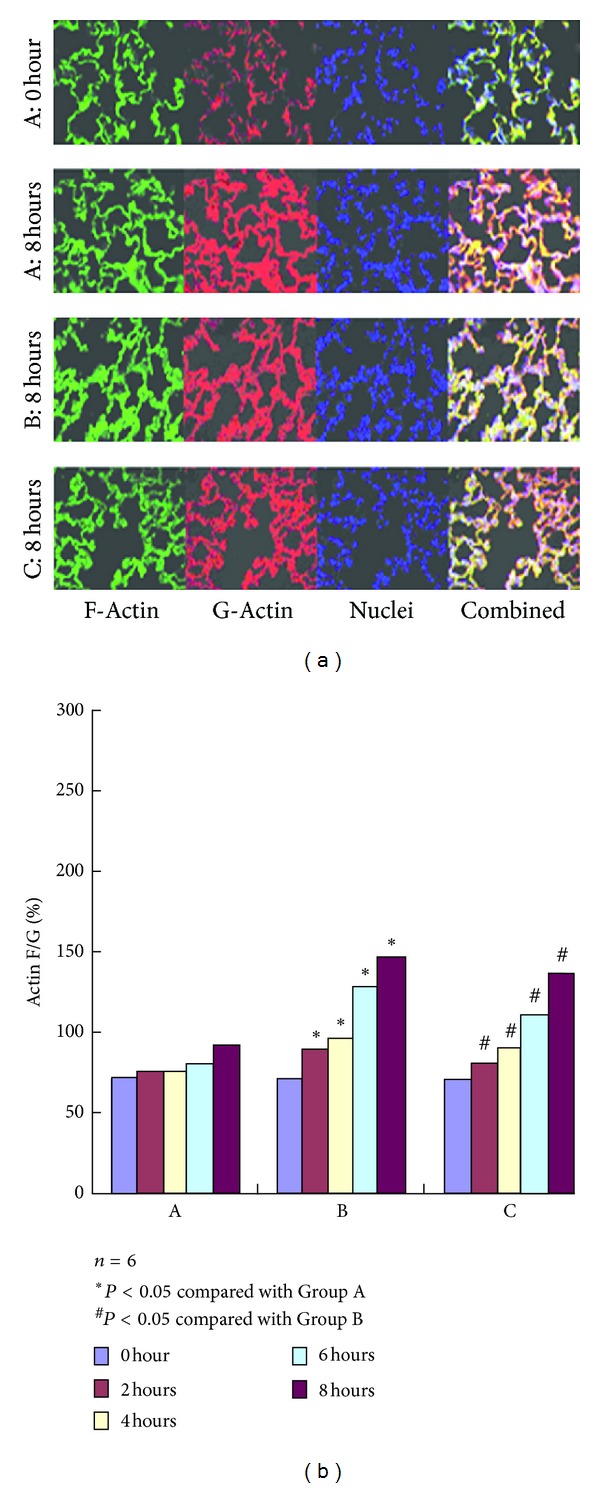
Figure 4.

F-actin and G-actin expression in Groups A, B, and C at different time points using Western blot analysis. The concentration of Western blot of banding of F-Actin and G-Actin had no significant variation at each time point after the experiment in Group A. The concentration of Western blot of banding of F-Actin begin to increase at 2 hours after the experiment in Group B, appeared to maintain a gradually increasing trend, but the concentration of Western blot of banding of G-Actin began to decrease, which is a significant difference compared with Group A. Compared with Group B, the concentration of Western blot of banding of F-Actin was significantly decreased, and that of G-actin were significantly increased in group C which was treated by SB203580, P < 0.05. There is statistical significance. As shown in (b) the ratios of F-Actin to G-Actin has no significant variation at each time point after the experiment in Group A. The ratios of F-Actin to G-Actin began to increase at 2 hours after the experiment in Group B and appeared to maintain a gradually increasing trend, significant difference compared with Group A. Compared with Group B, the ratios of F-Actin to G-Actin were significantly decreased in Group C which was treated by SB203580, P < 0.05. There is statistical significance.
