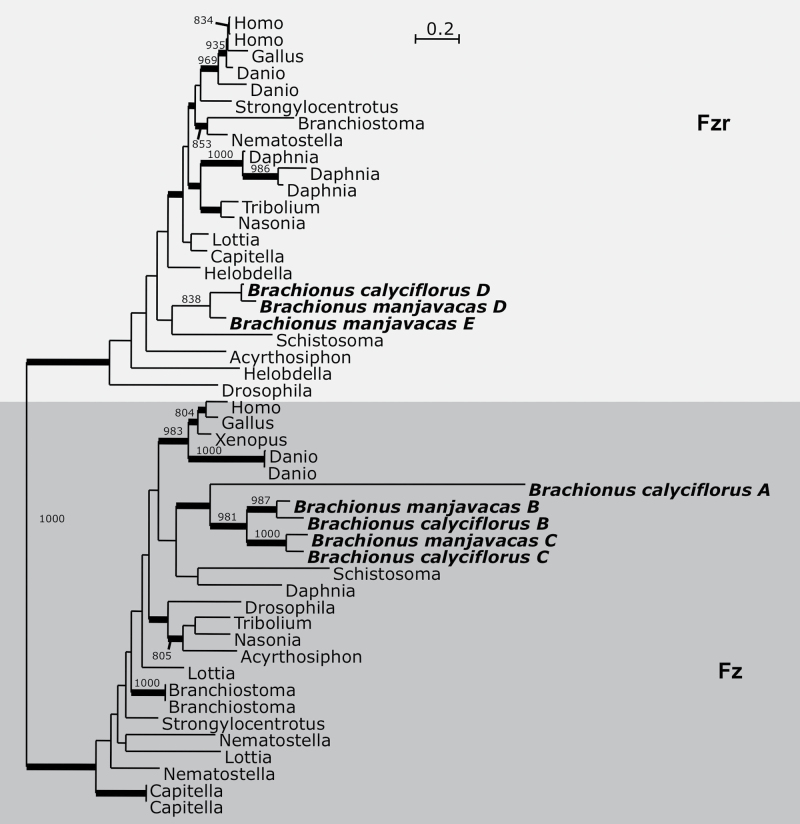
Figure 4.
Bayesian phylogenetic analysis of Cdc20 paralogs. Monogonont sequences are highlighted in bold. Thickened branches indicate posterior probability of >0.95. Numbers on branches note the bootstrap value in maximum likelihood analysis—only values >750 shown. Phylogeny based on an alignment of 360 amino acid positions. Tree shown is a consensus of 991 best trees with mean ln L = −16 297.42 and mean α = 1.04.

