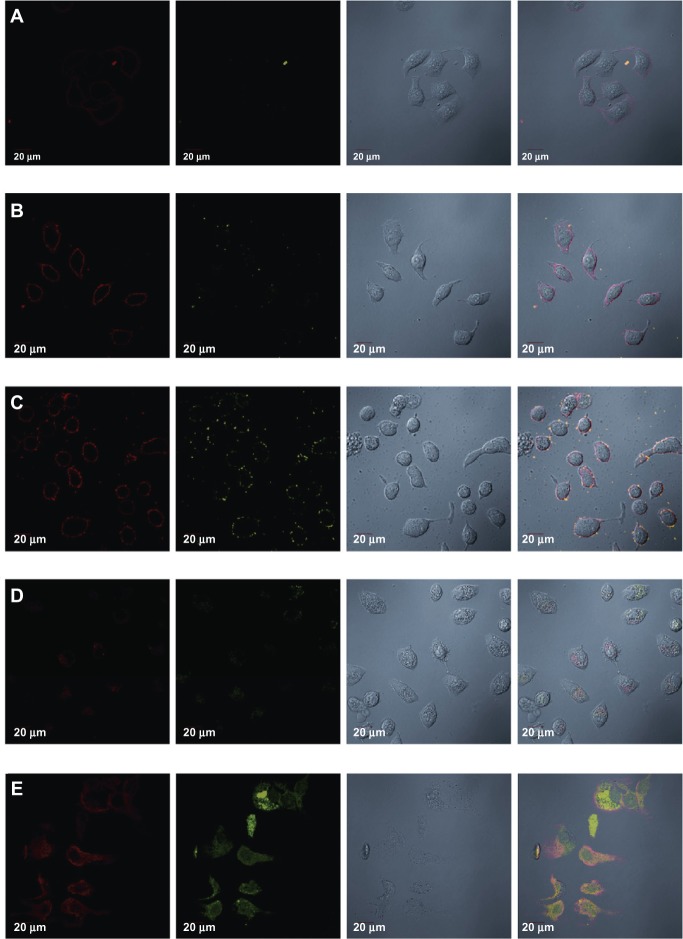
Figure 2.
Laser confocal images of Tca8113 cells showing specific targeting of survivin siRNA–QD and time lapse fluorescence imaging of QD–siRNA complexes and their transport in living cells. (A) QDs (red) adsorbed onto the cell surface immediately after being added into the cell culture, shown as red fluorescence, at the cell membrane; but siRNAFAM (green) could not be observed. This means that fluorescence from FAM is weaker than from QDs. (B) Fluorescence after 15 minutes. Red fluorescence remained mainly in the cell membrane, did not enter the cytoplasm, and was more intense. We can observe little green fluorescence in the cell membrane. (C) Fluorescence after 1 hour. Red fluorescence and a lesser amount of green fluorescence distributed around the cell membrane. (D) Fluorescence after 2 hours. QD–siRNA complex entered cells after less than 2 hours of incubation; some red fluorescence and a lesser amount of green fluorescence appeared in the cytoplasm. (E) Fluorescence after 6 hours. QD–siRNA complex fully accessed the cells.
Notes: QDs mainly distributed in the cytoplasm, while siRNA distributed in the cytoplasm and the nucleus, indicating that the survivin siRNA targeted the survivin gene of the whole Tca8113 cells. Magnification: 60×.
Abbreviations: siRNA, short interfering RNA; QDs, quantum dots; siRNAFAM, siRNA with fluorescein amidite; FAM, fluorescein amidite.

