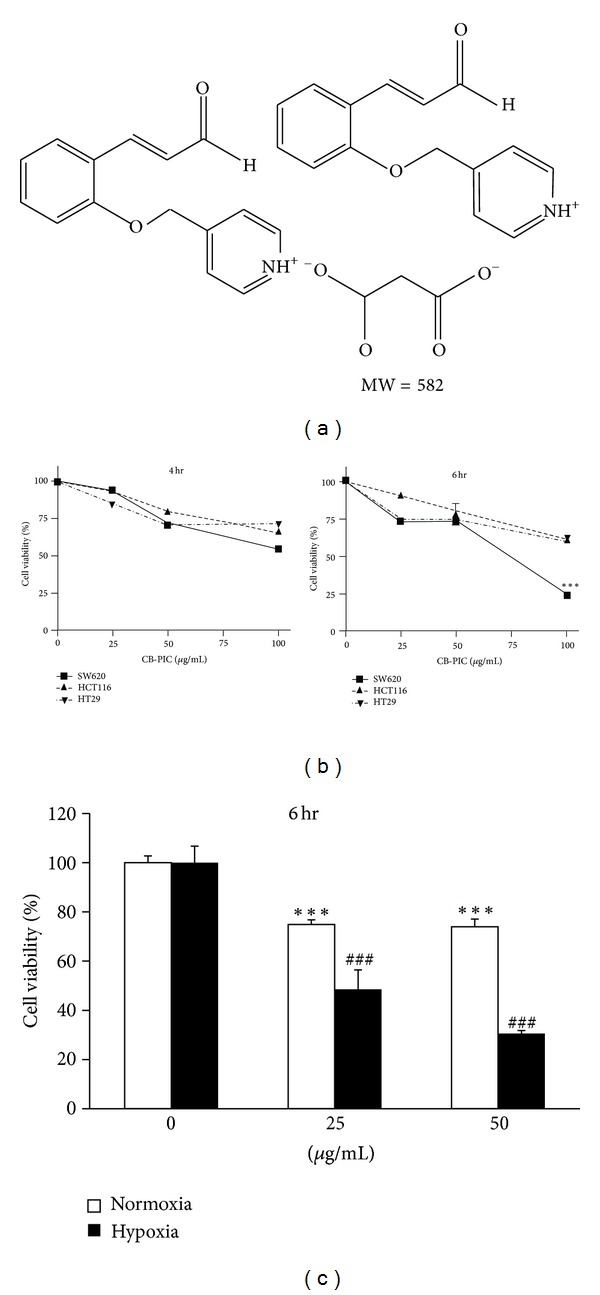
Figure 1.

(a) Chemical structure of CB-PIC. Molecular weight = 582. (b) SW620, HC116, and HT29 cells were treated with various concentrations of CB-PIC (0, 25, 50, or 100 μg/mL) for 4 and 6 hr. Cell viability was analyzed by MTT assay. (c) Cells were exposed to normoxia or hypoxia for 6 hours with CB-PIC (0, 25 or 50 μg/mL). Data are presented as means ± SD. ***P < 0.001 compared with control and ### P < 0.001 compared with hypoxia control.
