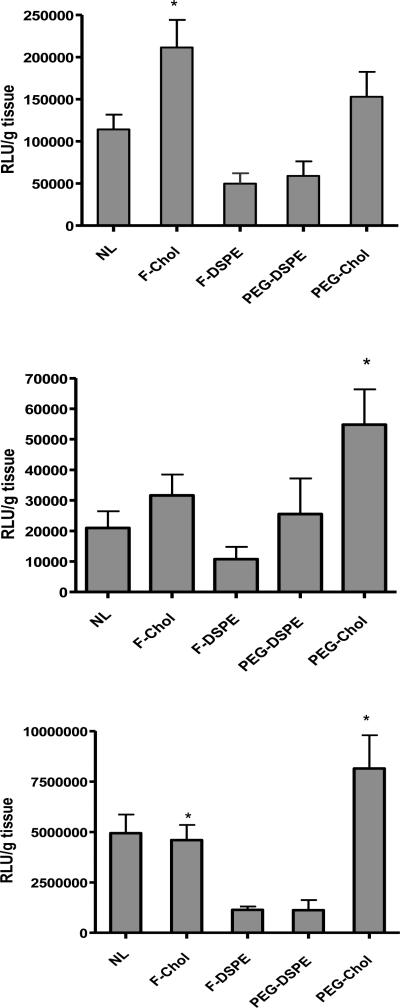
Figure 2.
Luciferase expression in tumors (A), livers (B) and lungs (C) 24 hours after intravenous injection. A) Asterisk indicates a significant difference (p<0.05) as compared to the no ligand control and those with folate-DSPE or PEG-DSPE. B) Asterisk indicates a significant difference (p<0.05) as compared to the no ligand control. C) Asterisk indicates a significant difference (p<0.05) for comparisons between folate-cholesterol and folate-DSPE and between PEG-cholesterol and PEG-DSPE. The data represent the mean + one standard error of 8-12 mice in each group. NL: no ligand; F-chol: folate-cholesterol; F-DSPE: folate-DSPE; PEG-chol: PEG-cholesterol.

