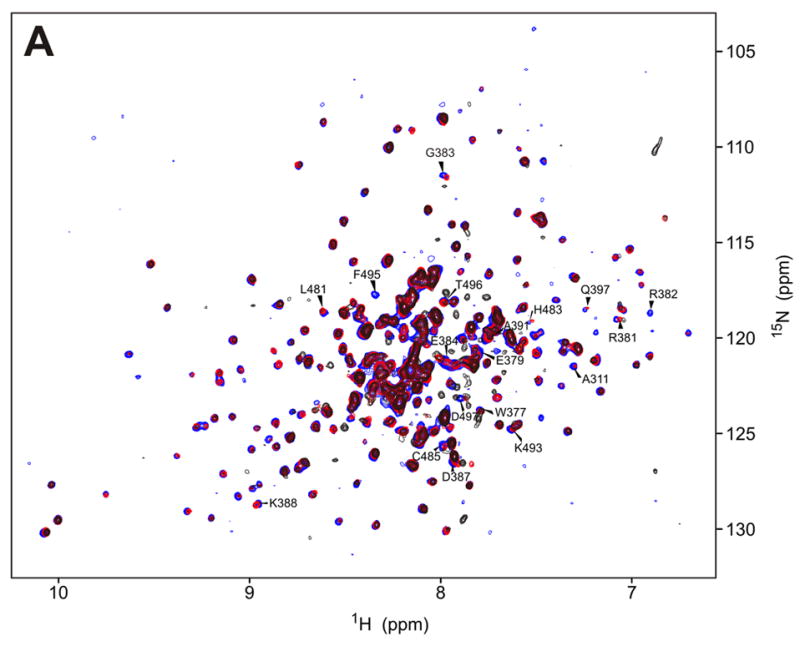
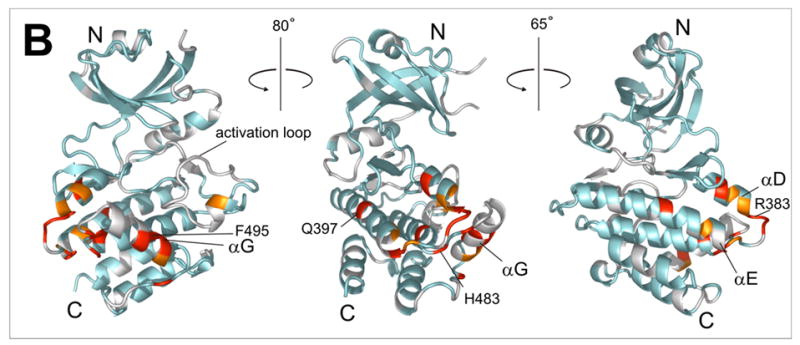
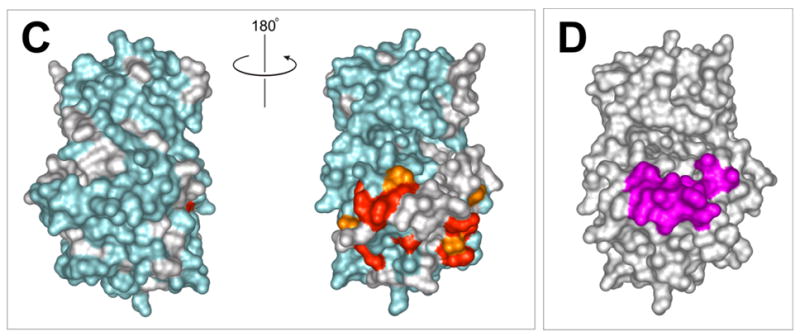
Figure 3.


a) 15N-HSQC spectra of the kinase domain alone (0.1 mM, blue trace) and in the presence of 0.2 mM (red) and 0.7 mM (black) RBD2 (97-178). Amide residues that display the most significant changes are labeled; b) Structure of the PKR KD15 (PDB 2A1A) showing in red the locations of the affected amide labeled in (a) (orange: 0.03ppm > δδ > 0.01ppm; red: δδ > 0.03ppm). Unassigned and ambiguous residues are shown in gray, while unaffected residues are in cyan; c) Surface representation of the results shown in (b). The view on the right corresponds to the orientation of the middle structure in (b) and is identical to (d); d) Structure of the KD showing the eIF2α docking site. Residues within 5 angstroms of resolved eIF2α atoms are colored purple.
