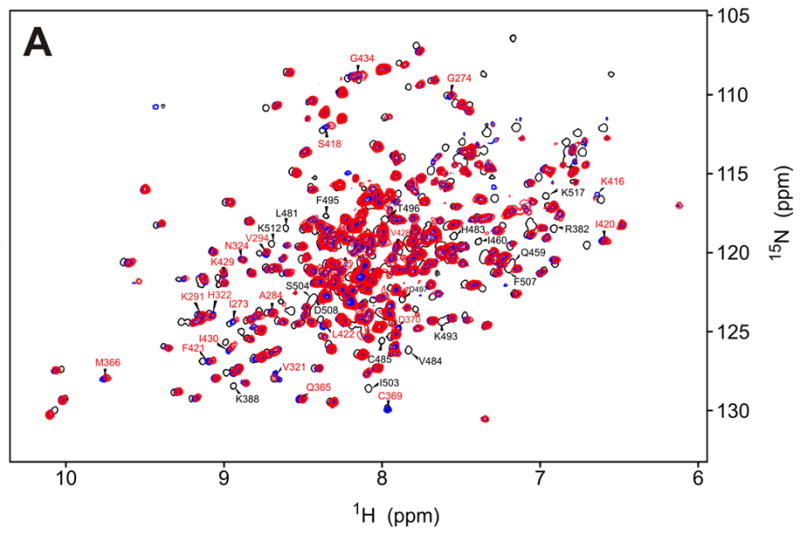
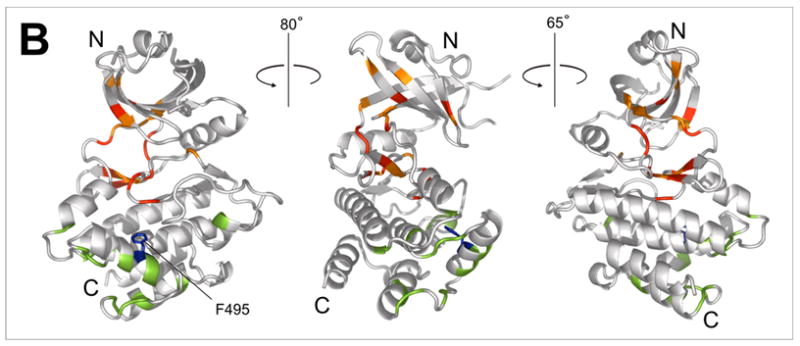
Figure 6.


a)15N-HSQC spectrum of the F495A/K296R kinase alone (blue) and in the presence of 5-fold excess RBD (1-178) (red). Affected residues (red labels) are assigned based on the corresponding peaks in the K296R KD spectrum (black trace). Major differences between the K296R and the K296R/F495A spectra are observed in the vicinity of F495 (labeled in black letters); b) Mapping of the residues indicated in (a) on the kinase structure. Chemical shift changes upon addition of RBD are indicated in red (δδ > 0.03ppm) and orange (0.03ppm > δδ > 0.01ppm). Differences in the spectra of K296R and K296R/F495A labeled in (a) are colored green. The mutated F495 is shown in blue.
