Figure 3.
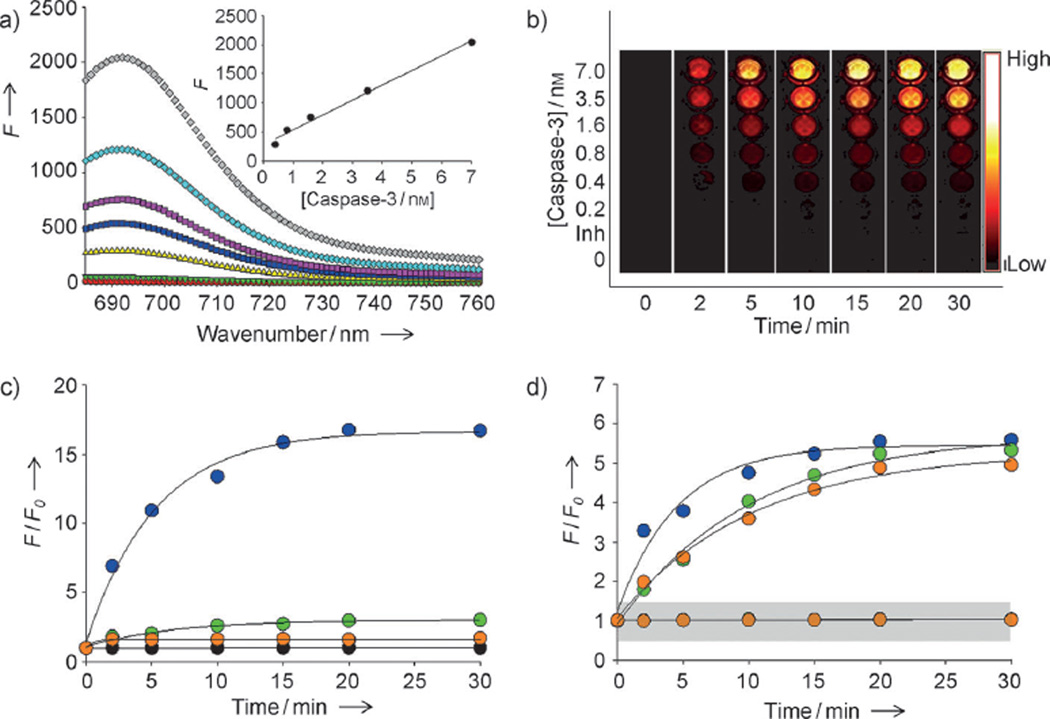
Enzyme specificity of the nanosensor targeting multiple caspases. a) Fluorescence emission spectra of C3Q3-MSNs in the presence of various concentrations of caspase-3 (in nm: 0 black, 0.2 light green, 0.4 yellow, 0.8 dark blue, 1.6 purple, 3.5 light blue, 7 gray) and caspase-3 with inhibitor (red). Inset: caspase-3 standard curve. The excitation was set at 675 nm. b) Fluorescence image sections of a 96-well microplate at different time points after incubation of C3Q3-MSN with various concentrations of caspase-3 with (Inh.) or without inhibitor (low=0; high=0.12×10⁶×photons cm−2 s−1). c) The relative increase in fluorescence (F/F0) produced by C3Q-MSNs in the presence of 7 nm caspase-3 (blue), caspase-8 (green), or caspase-9 (orange), or in the absence of any of the caspases (black). The excitation was set at 675 nm and the emission was recorded at 695 nm. d) F/F0 of CQ-MSNs in the presence (upper lines) or absence (lower lines in grey zone) of caspase-3 (blue), caspase-8 (green), or caspase-9 (orange); the excitation wavelengths were set at 675, 470, and 560 nm, respectively, and the emission spectra were recorded at 695, 520, and 600 nm, respectively. Datapoints represent the means of triplicate experiments and standard deviation.

