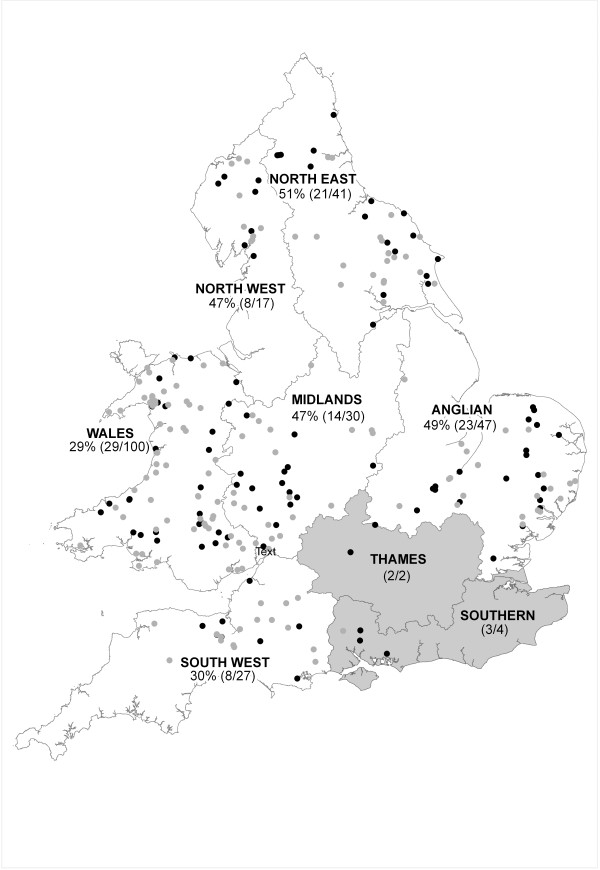
Figure 1.
Spatial variation in Toxoplasma gondii seroprevalence in UK otters. Individual otters tested are shown in black (seropositive) or grey (seronegative). The percentage of Eurasian otters seropositive for Toxoplasma gondii is indicated for each of eight Regions (Environment Agency management Regions, based on groups of river catchments), and numbers of seropositive/total number of individuals tested are shown in parentheses. Results for Thames and Southern Regions, shaded grey, were excluded from analyses due to low sample size (n < 5).

