Abstract
A nanoscale RGD–pyrene–graphene oxide (GO) biosensor was prepared for real-time in situ detection of a cancer cell surface marker, integrin αvβ3. This nanoscale GO-based biosensor is simple, robust, sensitive and of high selectivity. It can also be adapted to other cancer cell surface marker evaluation systems.
With the fast advancement of nanotechnology, many nanomaterials including quantum dots, carbon nanotubes, magnetic nanoparticles, and gold nanoparticles or nanorods etc., have been integrated with biomolecules for advanced biomedical applications, such as drug/gene delivery,1 bioimaging2–4 and biosensing.5 Graphene, a 2D honeycomb lattice consisting of sp2-hybridized carbons, has recently drawn much attention due to its distinct electronic, mechanical, optical and thermal properties from other carbon materials for various applications.6 The oxidized counterpart of graphene, graphene oxide (GO), provides a new type of aqueous dispersible biocompatible material for biological applications. GO has been reported to be an effective drug delivery system to carry poorly water soluble anticancer drugs for cancer therapy.7,8 Due to the aromatic domain and multiple ionic components of the basal plane, GO bears the unique capacity to absorb biomolecules, such as nucleic acid9,10 or protein,11 to behave as a sensitive biosensor. In addition, the sp2 aromatic domain of GO results in the quenching effect of nascent fluorescent dyes via fluorescence resonance energy transfer (FRET) or dipole–dipole coupling effects.12 This property facilitates GO to serve as a fluorescence quencher for fluorescence “on–off” biosensing.
So far, GO has been employed to detect various biomolecules. Noncovalent binding of GO with dye-labeled single strand DNA (ssDNA) enables efficient detection of target DNA in biological samples.10 GO can also be combined with dye-tagged peptides to sense protease activities.13,14 In addition, the modified GO has been used to sense ATP activity15,16 and prostate specific antigen (PSA) detection.17 Although there are many GO based biosensors available, the use of GO as a sensitive biosensor for highly specific cancer cell surface marker detection remains unexplored.
As one of the widely used fluorescent dyes, pyrene possesses large extinction coefficient, high quantum yield, and good stability in aqueous media.18 Because of these attributes, pyrene has been used as an optical reporter molecule for the detection of infectious prion protein19 and DNA.20
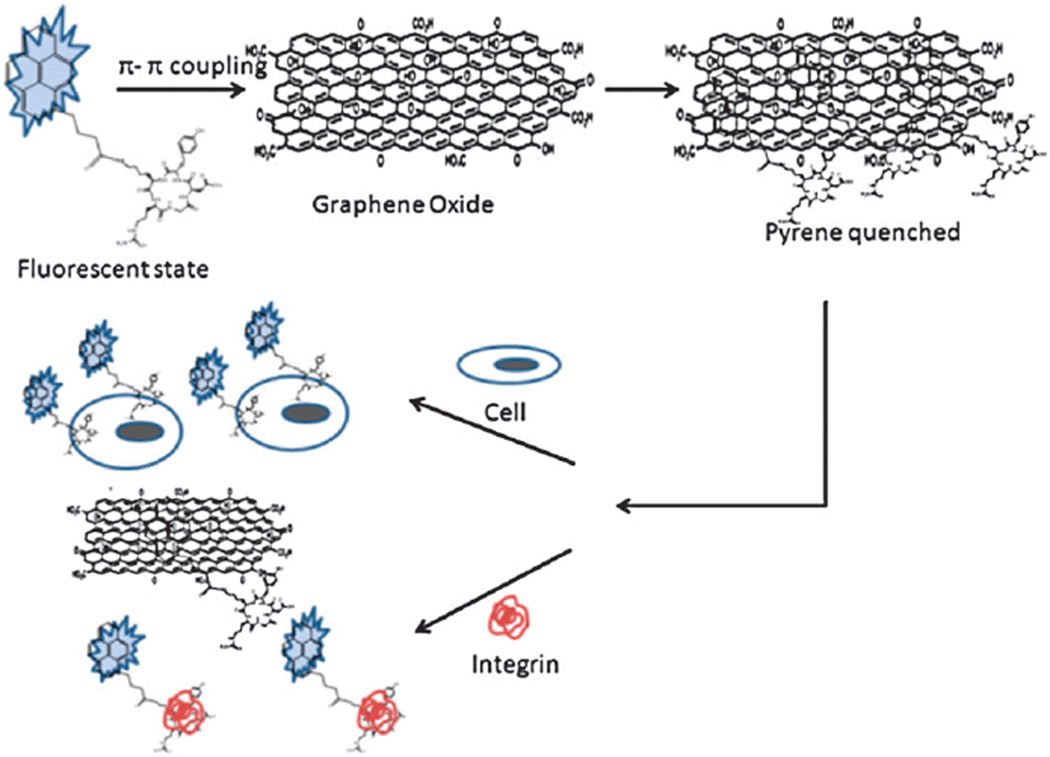
Additionally, pyrene and its derivatives present noncovalent interaction with molecules with a π-electron rich framework, such as GO, carbon nanotubes, and fullerenes.21 Hence, the combination of GO and pyrene provides an ideal platform for biosensing. In this study, we report a GO-based biosensor to efficiently detect cancer cell surface markers. As a proof-of-principle, we employed cyclic RGD peptide and integrin αvβ3 as a ligand–receptor pair for GO based biosensing due to the vital role of integrin in cancer cell adhesion, proliferation, migration and metastasis.22 This GO based biosensor system is initially at a quenching state due to the proximity of RGD–pyrene to GO upon π-stacking interactions. However, the competitive binding of an RGD receptor, integrin αvβ3, to the RGD ligand disturbs the adsorption of RGD–pyrene onto the GO surface, resulting in the recovery of pyrene fluorescence. In addition to the detection of purified integrin protein in buffer, which is a routinely used method under many biosensor working conditions, we further demonstrated the effectiveness for in situ detection of integrin overexpression in live and fixed breast cancer cells.
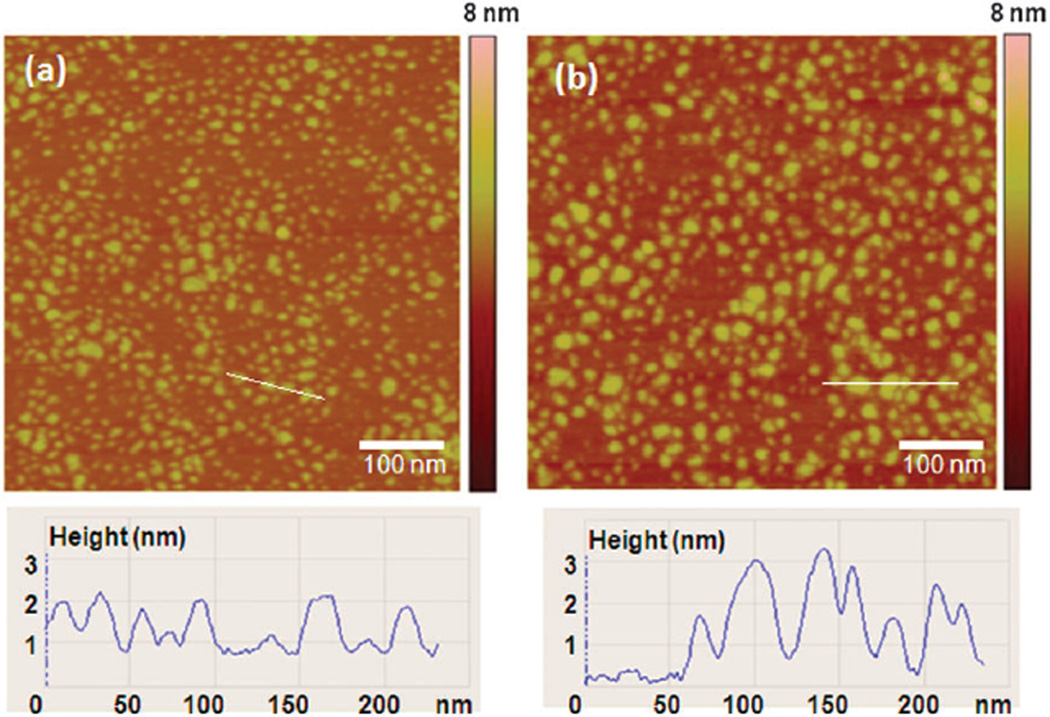
Scheme 1 illustrates the principle of RGD–pyrene–GO biosensor for sensitive detection of integrin αvβ3 in solution or on the cell surface membrane. A head-to-tail cyclic RGD containing peptide, c(RGDyK), was used here due to its high receptor binding affinity.2,23 The as-synthesized RGD–pyrene conjugate (Fig. S1, ESI†) presents sol–gel character in aqueous solution at concentration ≥3 mM. For cell surface marker detection, we used a low concentration of this conjugate, 2 µM, at which it is well-dispersed in solution. Upon addition of RGD–pyrene into GO solution, the strong interaction of pyrene with the basal plane of GO results in immediate quenching of pyrene fluorescence due to the energy transfer between GO and pyrene. Fig. S2a (ESI†) shows the UV/Vis spectra of RGD–pyrene with GO. It can be seen that the GO peak at 230 nm is slightly shifted to 232 nm in the RGD–pyrene–GO complex, and the absorption peak of RGD–pyrene at 348 nm is shifted to 351 nm. These slight red shifts indicate the π–π interaction of pyrene with GO. To investigate the dynamic interaction range of GO with the RGD–pyrene conjugate, the absorption peak values at 232 nm were plotted against the RGD–pyrene–GO complex concentrations (Fig. S2b inset, ESI†). The extinction coefficient of the RGD–pyrene–GO complex was estimated by Beer’s law from the slope of linear square fit.20 It was found to be 0.0088 L mg−1 cm−1 with an R2 value of 0.9996. Fig. S2c (ESI†) shows the fluorescence spectra of RGD–pyrene at different concentrations with an excitation wavelength of 338 nm. The linear relationship between the fluorescence intensity at the 400 nm emission peak and RGD–pyrene concentration (Fig. S2c inset, ESI†) confirms the good dispersion of the GO–RGD–pyrene complex in aqueous solution. The atomic force microscopy (AFM) images shown in Fig. 1 confirm the formation of the GO–peptide complex with good dispersion, and maintenance of the original nanoscale character of GO. The adsorption of RGD–pyrene on GO resulted in 1–1.5 nm increase in thickness, and marginal increase in size (Fig. 1b).
Scheme 1.
Schematic illustration of RGD–pyrene interaction with GO to quench the fluorescence of pyrene, and the fluorescence recovery by introducing either integrin αvβ3 protein or integrin over-expressing cancer cells. Size is not in scale.
Figure 1.
Atomic force microscopy (AFM) images of nanoscale graphene oxide before (a) and after (b) decorated with RGD–pyrene.
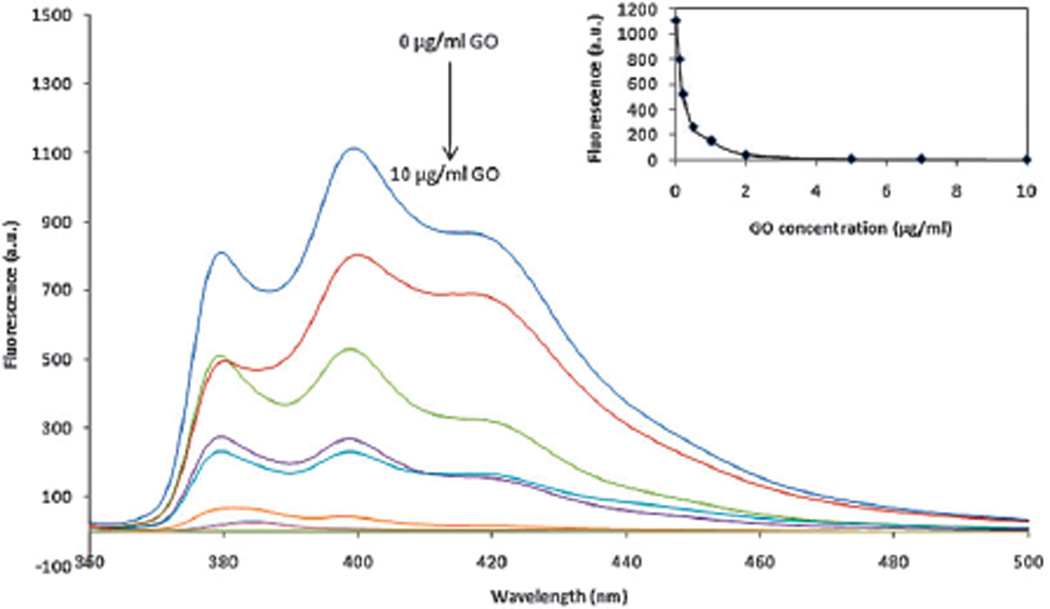
Next, we investigated the quenching effect of GO on the fluorescence of the RGD–pyrene conjugate. Fig. 2 shows the concentration dependent fluorescence quenching effect of GO on RGD–pyrene in aqueous solution. An exponential reduction of RGD–pyrene was observed with increasing concentration of GO. The quenching efficiency of GO is calculated by using the formula: QE = (1 − α) × 100%, where α is the ratio of fluorescence quenched to the original fluorescence of the RGD–pyrene conjugate. Hence, the QE of GO to the RGD–pyrene conjugate (2 µM) is calculated to be 96.2 ± 0.13%. Higher concentrations of GO did not further quench the fluorescence of pyrene significantly. In the subsequent studies, 2 µM RGD–pyrene and 2 µg mL−1 GO were used for integrin biosensing.
Figure 2.
Fluorescence spectra of RGD–pyrene in the presence of various concentrations of GO (0, 0.1, 0.2, 0.4, 0.8, 1, 2, 5, 7, 10 µg mL−1). Inset presents the plot of fluorescence intensity at 380 nm against the concentration of GO. λex: 338 nm.
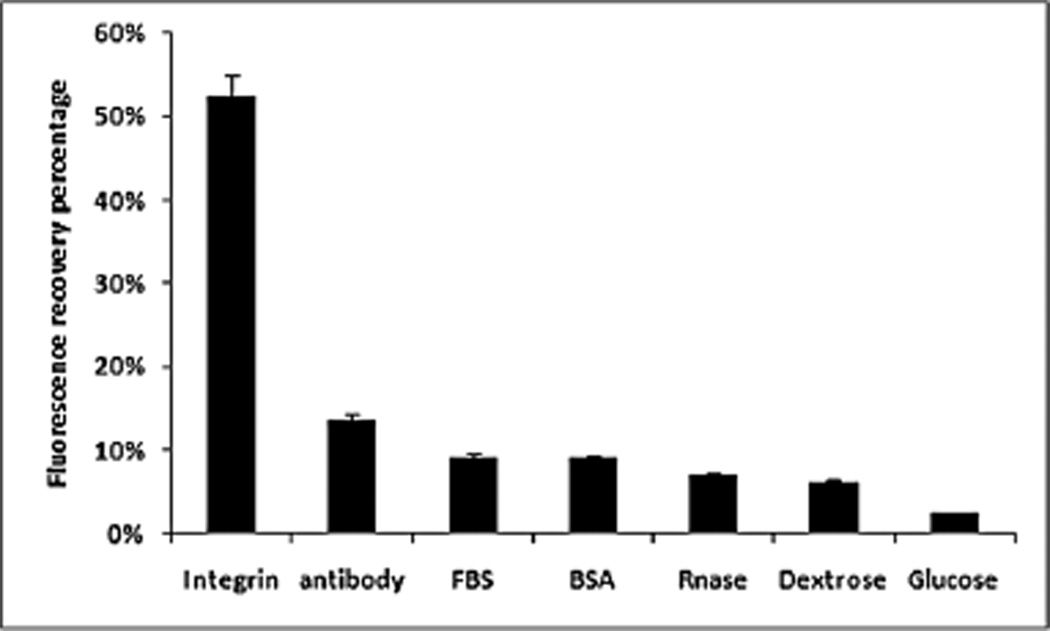
In the presence of purified integrin αvβ3 in RGD binding buffer (pH 7.4), the fluorescence intensity enhancement of RGD–pyrene–GO was observed (Fig. S3, ESI†). This fluorescence recovery (FR) indicates that the competitive binding of RGD–pyrene with integrin dissociates the π–π coupling and hydrophobic interaction of GO with pyrene (Fig. S3a, ESI†), and the recovered fluorescence intensity increased in accordance with the ascending concentrations of integrin in buffer (Fig. S3b, ESI†). To study the binding specificity of this RGD–pyrene probe to integrin αvβ3, we investigated the fluorescence recovery of RGD–pyrene in various biological samples. As shown in Fig. 3, the probe exhibited little FR to nonspecific biological moieties, while the FR of integrin αvβ3 to the RGD–pyrene probe was up to 52.3%. This result confirms that the RGD–pyrene probe can be used as a selective fluorescent probe to target the cancer surface marker, integrin αvβ3.
Figure 3.
Specificity of integrin in recovering the fluorescence of the RGD–pyrene–GO complex.
The kinetic behavior of RGD–pyrene with GO was studied by recording the fluorescence intensity as the function of time (Fig. S4, ESI†). Fig. S4a (curve a, ESI†) presents the kinetics of fluorescence quenching of pyrene in the presence of GO over time. The interaction of RGD–pyrene with GO was very fast at room temperature (22 °C), reaching an equilibrium within 1 min. When the RGD–pyrene–GO complex was exposed to integrin, the competitive binding of integrin to the RGD ligand resulted in gradual dissociation of the RGD–pyrene probe from the GO surface, leading to a time-dependent FR. The recovery reached maximum and plateaued after 10 min incubation (Fig. S4, curve b, ESI†). This fast kinetic behavior of RGD–pyrene–GO and integrin enables highly selective and efficient detection of integrin for biosensing.
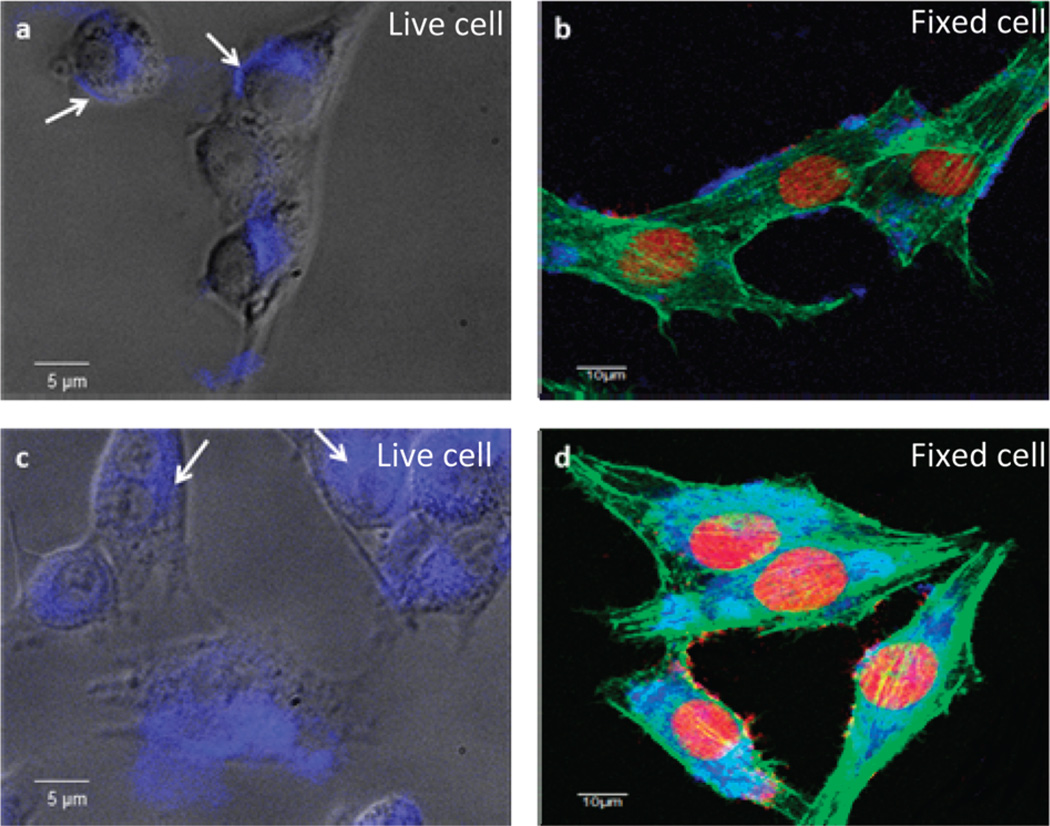
Next, we applied this RGD–pyrene–GO probe to cancer cells for in situ cell surface marker evaluation. We chose the MDA-MB-435 cell line, which was reported to overexpress integrin on the cell surface,24 and MCF-7 which has very low integrin expression level25 for comparison. After 2 hour incubation of the probe and corresponding cancer cells, the pyrene fluorescence signal was recovered in the MDA-MB-435 cell culture (Fig. 4a and b, Fig. S6, ESI†), while a negligible fluorescent signal was detected from the MCF-7 cells (Fig. S6 and S8, ESI†). Free c(RGDyK) peptide effectively blocked the recovery of fluorescence in MDA-MB-435 cell culture, which confirmed the specificity of the RGD–pyrene–GO probe (Fig.S6 and S8, ESI†). In contrast, fluorescent RGD–pyrene without GO showed different cellular uptake behavior in which the GO free RGD–pyrene probe diffused into cytoplasm upon integrin binding (Fig. 4c,d and Fig. S6–S8, ESI†) after 2 h incubation. This is partially due to the hydrophobicity of pyrene. In contrast, the RGD–pyrene–GO probe bound to the cell surface membrane (Fig. 4a,b, white arrow, Fig. S6–S8, ESI†). Flow cytometry results (Fig. S5, ESI†) confirmed the above phenomena. This specific cell receptor binding study provides the initial evidence that the RGD–pyrene–GO complex is a suitable probe for real-time cancer cell integrin expression detection.
Figure 4.
Real-time in situ detection of breast cancer cell surface integrin expression by the RGD–pyrene–GO probe: (a) probe fluorescence recovery by live MDA-MB-435 cancer cells which overexpress integrin αvβ3 on the cell surface. The recovered fluorescence is mainly detected on the cell membrane as indicated by white arrows; (b) probe fluorescence recovery by MDA-MB-435 cancer cells followed by 4% formalin fixing; (c) equivalent concentration of free RGD–pyrene incubated with liveMDA-MB-435 demonstrates significant endocytosis as indicated by white arrows; (d) equivalent concentration of RGD–pyrene incubated with MDA-MB-435 followed by 4% formalin fixing.
In conclusion, we have designed a simple, robust graphene oxide (GO) based fluorescent biosensor for efficient, selective and real-time cancer cell surface marker integrin αvβ3 detection. We envision that this RGD–pyrene–GO biosensing system can be extended to evaluate other cell surface markers for cell surface marker imaging or ligand screening.
Supplementary Material
Footnotes
Electronic supplementary information (ESI) available.
Notes and references
- 1.Rosi NL, Giljohann DA, Thaxton CS, Lytton-Jean AK, Han MS, Mirkin CA. Science. 2006;312:1027–1030. doi: 10.1126/science.1125559. [DOI] [PubMed] [Google Scholar]
- 2.Cai W, Shin DW, Chen K, Gheysens O, Cao Q, Wang SX, Gambhir SS, Chen X. Nano Lett. 2006;6:669–676. doi: 10.1021/nl052405t. [DOI] [PubMed] [Google Scholar]
- 3.Xie J, Jon S. Theranostics. 2012;2:122–124. doi: 10.7150/thno.4051. [DOI] [PMC free article] [PubMed] [Google Scholar]
- 4.Zhen Z, Xie J. Theranostics. 2012;2:45–54. doi: 10.7150/thno.3448. [DOI] [PMC free article] [PubMed] [Google Scholar]
- 5.Fu W, Nef C, Knopfmacher O, Tarasov A, Weiss M, Calame M, Schonenberger C. Nano Lett. 2011;11:3597–3600. doi: 10.1021/nl201332c. [DOI] [PubMed] [Google Scholar]
- 6.Rao CN, Sood AK, Subrahmanyam KS, Govindaraj A. Angew. Chem., Int. Ed. 2009;48:7752–7777. doi: 10.1002/anie.200901678. [DOI] [PubMed] [Google Scholar]
- 7.Liu Z, Robinson JT, Sun XM, Dai HJ. J. Am. Chem. Soc. 2008;130:10876–10877. doi: 10.1021/ja803688x. [DOI] [PMC free article] [PubMed] [Google Scholar]
- 8.Sun XM, Liu Z, Welsher K, Robinson JT, Goodwin A, Zaric S, Dai HJ. Nano Res. 2008;1:203–212. doi: 10.1007/s12274-008-8021-8. [DOI] [PMC free article] [PubMed] [Google Scholar]
- 9.Li D, Song S, Fan C. Acc. Chem. Res. 43:631–641. doi: 10.1021/ar900245u. [DOI] [PubMed] [Google Scholar]
- 10.Lu CH, Yang HH, Zhu CL, Chen X, Chen GN. Angew. Chem., Int. Ed. 2009;48:4785–4787. doi: 10.1002/anie.200901479. [DOI] [PubMed] [Google Scholar]
- 11.Chang H, Tang L, Wang Y, Jiang J, Li J. Anal. Chem. 2010;82:2341–2346. doi: 10.1021/ac9025384. [DOI] [PubMed] [Google Scholar]
- 12.Kim J, Cote LJ, Kim F, Huang J. J. Am. Chem. Soc. 2010;132:260–267. doi: 10.1021/ja906730d. [DOI] [PubMed] [Google Scholar]
- 13.Feng D, Zhang Y, Feng T, Shi W, Li X, Ma H. Chem. Commun. 2011;47:10680–10682. doi: 10.1039/c1cc13975d. [DOI] [PubMed] [Google Scholar]
- 14.Wang H, Zhang Q, Chu X, Chen T, Ge J, Yu R. Angew. Chem., Int. Ed. 2011;50:7065–7069. doi: 10.1002/anie.201101351. [DOI] [PubMed] [Google Scholar]
- 15.Liu C, Wang Z, Jia H, Li Z. Chem. Commun. 2011;47:4661–4663. doi: 10.1039/c1cc10597c. [DOI] [PubMed] [Google Scholar]
- 16.Wang Y, Li Z, Hu D, Lin CT, Li J, Lin Y. J. Am. Chem. Soc. 2010;132:9274–9276. doi: 10.1021/ja103169v. [DOI] [PubMed] [Google Scholar]
- 17.Feng T, Feng D, Shi W, Li X, Ma H. Mol. BioSyst. 2012;8:1441–1445. doi: 10.1039/c2mb05379a. [DOI] [PubMed] [Google Scholar]
- 18.Lu CH, Li J, Zhang XL, Zheng AX, Yang HH, Chen X, Chen GN. Anal. Chem. 2011;83:7276–7282. doi: 10.1021/ac200617k. [DOI] [PubMed] [Google Scholar]
- 19.Tcherkasskaya O, Davidson EA, Schmerr MJ, Orser CS. Biotechnol. Lett. 2005;27:671–675. doi: 10.1007/s10529-005-4478-7. [DOI] [PubMed] [Google Scholar]
- 20.Balapanuru J, Yang JX, Xiao S, Bao Q, Jahan M, Polavarapu L, Wei J, Xu QH, Loh KP. Angew. Chem., Int. Ed. 2010;49:6549–6553. doi: 10.1002/anie.201001004. [DOI] [PubMed] [Google Scholar]
- 21.Xu Y, Bai H, Lu G, Li C, Shi G. J. Am. Chem. Soc. 2008;130:5856–5857. doi: 10.1021/ja800745y. [DOI] [PubMed] [Google Scholar]
- 22.Niu G, Chen X. Theranostics. 2011;1:30–47. doi: 10.7150/thno/v01p0030. [DOI] [PMC free article] [PubMed] [Google Scholar]
- 23.Gao J, Chen K, Xie R, Xie J, Yan Y, Cheng Z, Peng X, Chen X. Bioconjugate Chem. 2010;21:604–609. doi: 10.1021/bc900323v. [DOI] [PMC free article] [PubMed] [Google Scholar]
- 24.Wang H, Chen K, Cai W, Li Z, He L, Kashefi A, Chen X. Mol. Cancer. Ther. 2008;7:1044–1053. doi: 10.1158/1535-7163.MCT-07-2084. [DOI] [PubMed] [Google Scholar]
- 25.Ye Y, Chen X. Theranostics. 2011;1:102–126. doi: 10.7150/thno/v01p0102. [DOI] [PMC free article] [PubMed] [Google Scholar]
Associated Data
This section collects any data citations, data availability statements, or supplementary materials included in this article.


