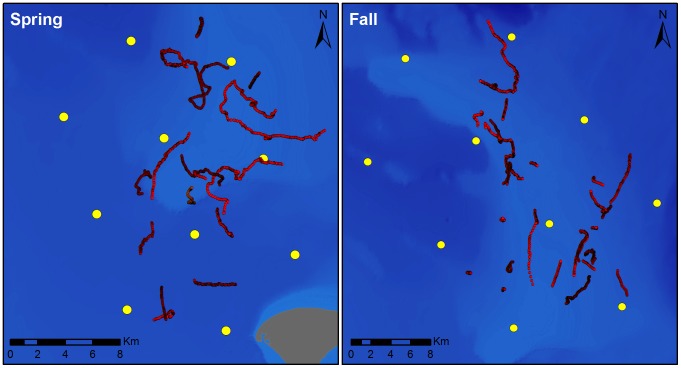
Figure 4. Maps of the acoustic tracks of singing humpback whales recorded during spring and fall 2009.
Yellow dots indicate the arrays of bottom-mounted Marine Autonomous Recording Units used for acoustic recording, localization, and tracking. Whale tracks are shown in red. Maps include all singing whales tracked during the spring and fall study periods; tracks did not occur simultaneously. Bathymetry map provided by M. Thompson, Stellwagen Bank National Marine Sanctuary.

