
Figure 8. Comparison of partitions obtained in underlying network and reconstructed network.
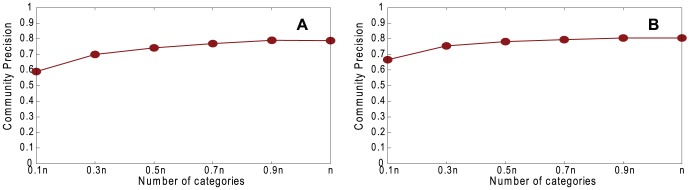
Community precision, varying g, with n = 1460, 〈k〉 = 20, k max = 30, μ = 0.1, τ 1 = 3, τ 2 = 1, c min = 10, and c max = 20. A. Random Path Method. B. High-degree Path Method.