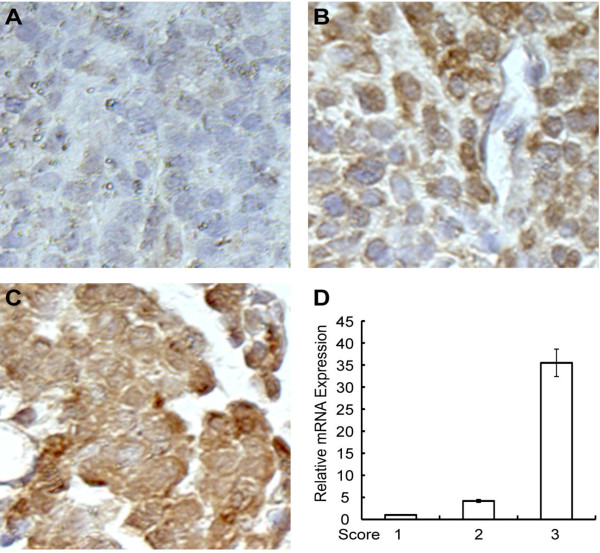
Figure 1.
IHC analysis of Smo protein expression in mesothelioma tissue samples. A-C: Representative images of IHC for evaluating Smo protein expression level with score of 1,2 and 3. A, 1-low level; B, 2-intermediate level; C, 3-high level. D, RT-PCR measuring Smo mRNA expression level of corresponding samples of 1–3 as in A-C.

