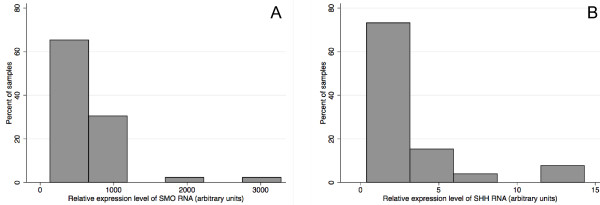
Figure 6.

Real-time RT-PCR analysis of expression level of (A) SMO and (B) SHH in MPM tissue samples. X-axis represents Relative expression level of SMO (A) or SHH (B) mRNA (arbitrary units). Y-axis represents percentage of the MPM tissue samples analyzed.
