
Figure 4.
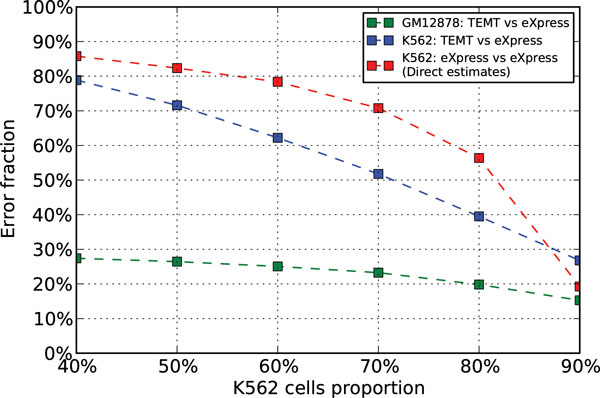
Analysis results of the ENCODE data of 6 different K562 cells proportions with the bias module disabled. The x-axis is the different K562 cells proportions, and the y-axis is the Error Fraction of the corresponding estimates. The green and blue lines are the estimates from TEMT for GM12878 and K562 cells, based on the read sets of the GM12878 cells pure sample and the mixed sample. The red line is the direct estimates from eXpress for K562 cells, based on the read set of the mixed sample.