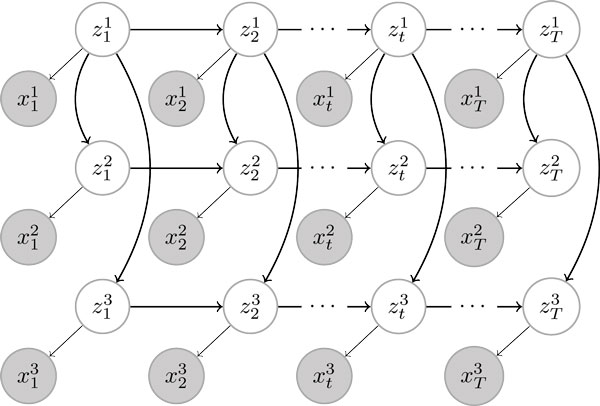
Figure 1.
Example graphical model for a tree-structured HMM with three cell types. Hidden state variables representing chromatin states (white) are connected horizontally in a chain as well as vertically in a tree structure. Each chain in the graph represents a certain cell type. For example, the top chain represents the root cell type (e.g., ES cells). Observed nodes (grey) represent chromatin modifications and are connected only to the hidden variables.

