
Figure 1.
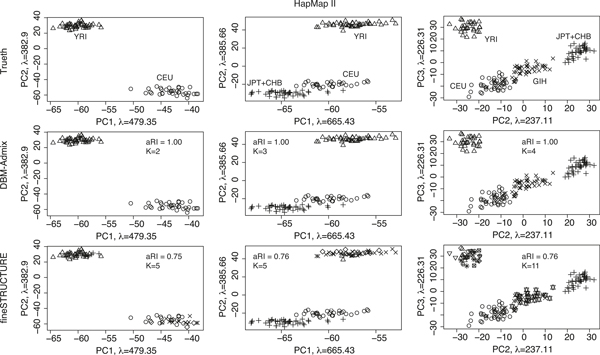
Comparison of de novo structure inference in HapMapII data. Each plot shows individuals (haplotypes) in different origins (shown in symbols) projected onto the principal components (λ denotes eigen values). Top: true origins. Middle: origins inferred by DBM-Admix. Bottom: origins inferred by fineSTRUCTURE. Columns from left to right correspond to datasets containing 2, 3 and 4 populations, respectively. aRI: adjusted rand index. K: estimated number of populations.