
Figure 6.
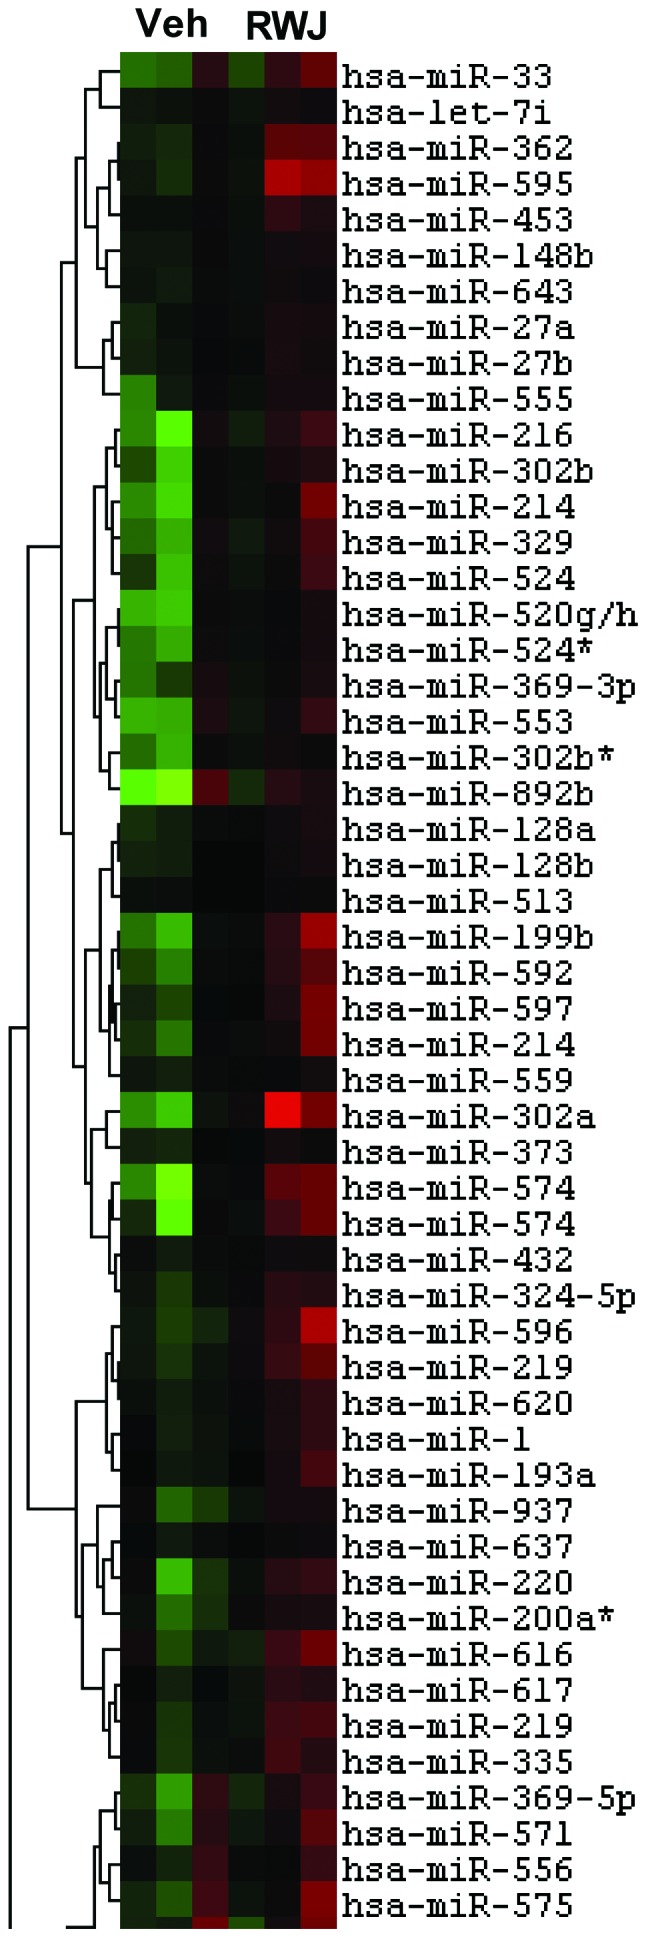
Clustering analysis of microRNA expression profiles of RWJ67657. MCF-7 and MCF-7TN-R have distinctive microarray expression patterns, with samples of same cell lines clustered together. Trees on the left are gene clusters. Red color indicates upregulation and green color indicates downregulation.