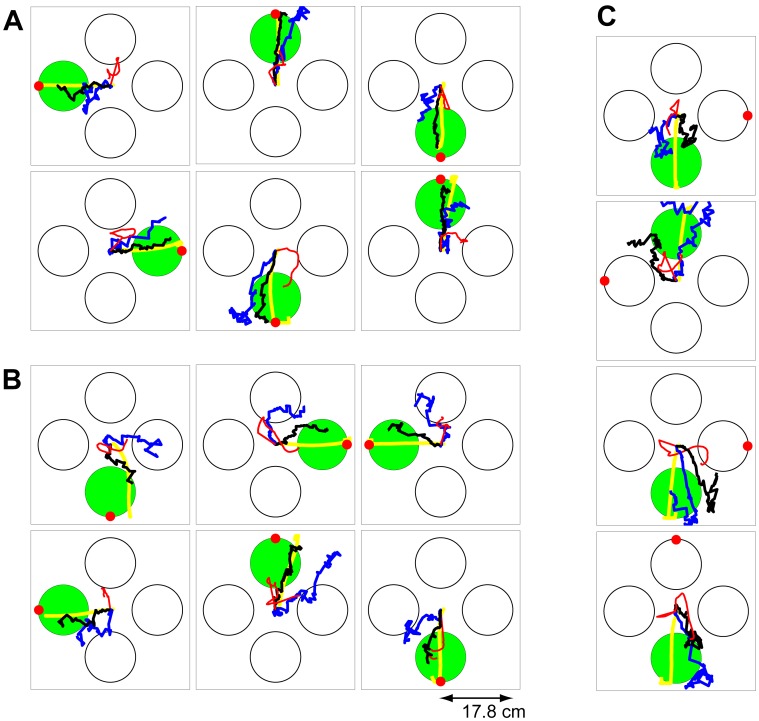
Figure 3. Comparison of the offline trajectory estimates.
The green circle shows the instructed target and the yellow line shows the monkey's trajectory. The black line shows the trajectory estimate using the two-stage decoder, the red circle shows the predicted target from the first stage, the blue line shows the trajectory estimate of RW-PPF (i.e., the second stage of the decoder without using the target prediction), and the red line shows that of the linear ridge regression decoder. (A) Sample trials in which both the two-stage decoder and RW-PPF acquire the target correctly. (B) Sample trials in which the two-stage decoder acquires the target correctly but RW-PPF does not. (C) Sample trials in which the two-stage decoder acquires the target correctly but the target is predicted incorrectly from the first stage.

