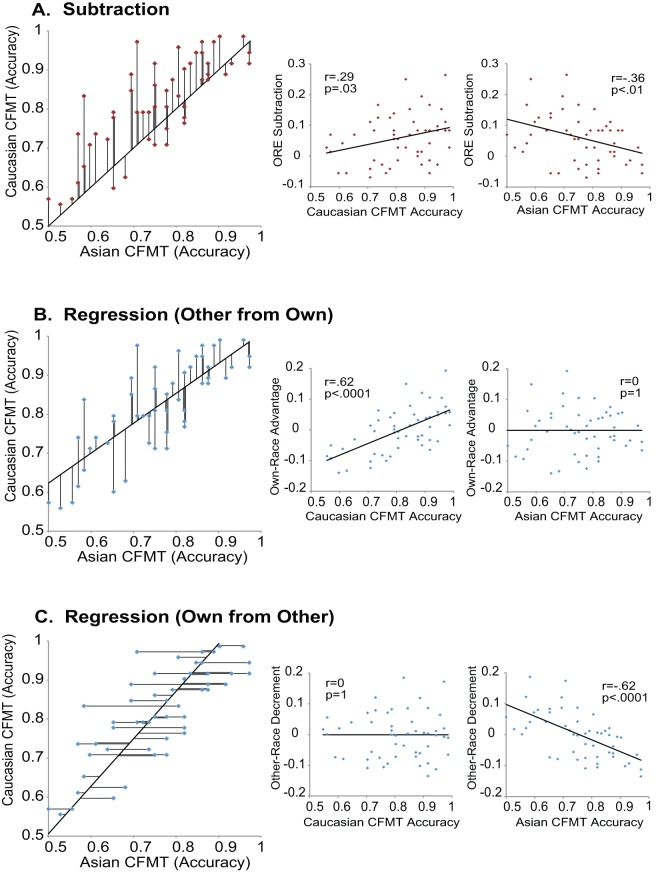
Figure 2. Other-race effect measures for the Cambridge Face Memory Test and their correlations with their constituent conditions.
Individual differences in the other-race effect were calculated three ways: A) subtraction, where other-race performance is subtracted from own-race performance to produce a difference score (top row, red plots, each difference score is indicated with a vertical black line), B) regressing other- from own-race performance to produce own-race advantage residuals (second row, blue plots, each regression residual is indicated with a vertical black line), or C) regressing own- from other-race performance to produce other-race decrement residuals (third row, blue plots, each regression residual is indicate with a horizontal black line). As can be seen in the smaller graphs on the right, the subtraction approach creates a measure that is both positively correlated with own-race performance and negatively correlated with other-race performance. In contrast, the own-race advantage residuals are correlated with own-race performance but not with other-race performance, whereas other-race decrement residuals are correlated with other-race performance but not with own-race performance.

