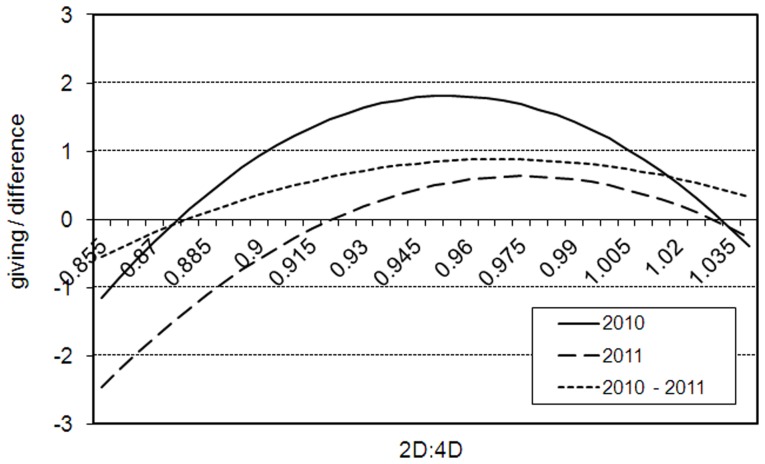
Figure 2. The estimated relation.
Dictator's giving in 2010 (solid), 2011 (dashed) and updating of behavior from 2010 to 2011 (dotted) on  -axis and 2D:4D (
 -axis); censored regression analysis; right hands. Estimated results: (i) 2010:
  , (ii) 2011:
  , (iii) 2010–2011:
  . The reported estimations control for heterogeneity; control variables are held at their averages.

