
Figure 1. Upregulation of OX40 and OX40L in human sepsis.
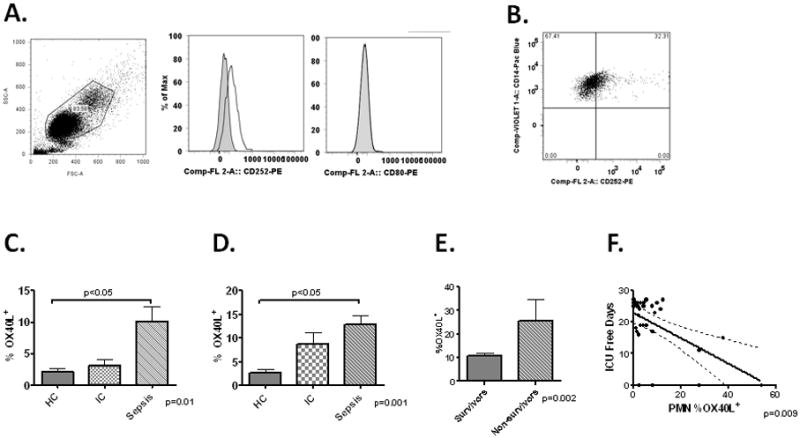
Panel A-Representative scattergram of whole blood gated from a septic patient on Day 1 gated on PMNs by FSC/SSC. Histogram of PMN OX40L (CD252-middle panel) and CD80 expression (right panel). Panel B –Representative dot plot of CD14+ monocytes (identified by FSC/SSC) expression of OX40L in a septic subject. Gates determined by isotype stained controls. Panel C-Quantification of PMN OX40L expression (MFI) from healthy controls (HC-N=8), ICU controls (IC-N=8) and septic patients and day 1 (Sepsis-N=32). Panel D- Quantification of OX40L MFI on circulating CD14+ monocytes in the same groups. Panel E- Monocyte OX40L expression (MFI) on admission to the ICU in survivors (N=26) and non-survivors (N=6). Panel F.-Correlation between day 1 PMN OX40L expression (MFI) and ICU free days among septic patients.