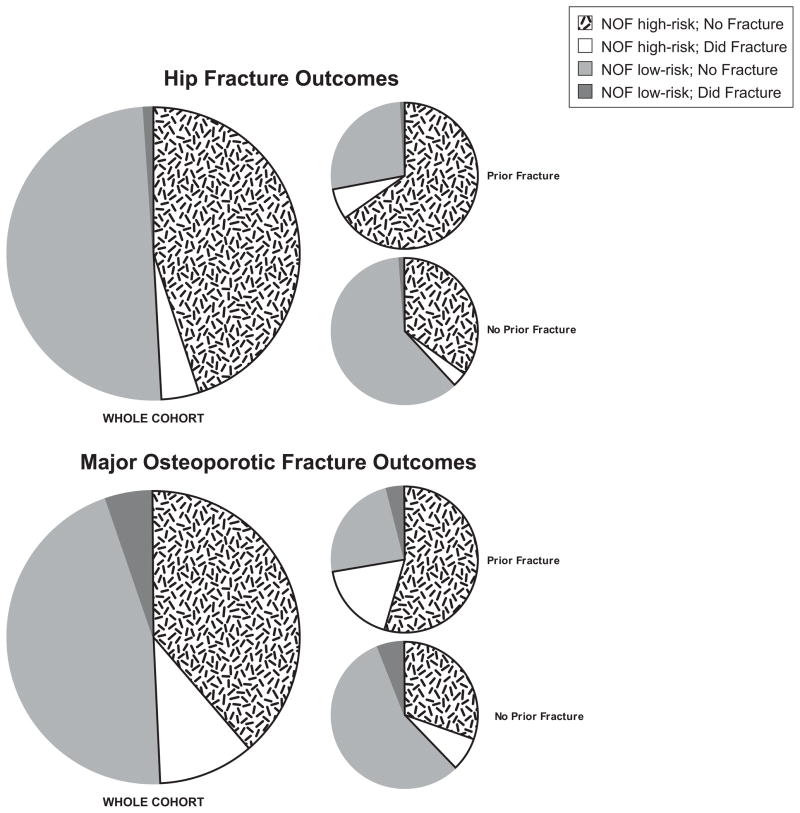
Figure 2.
Proportion of women with low bone mass (n=4464) at baseline exam that would meet current National Osteoporosis (NOF) treatment thresholds (high-risk; n=2218) or not (low-risk; n=2246), with further stratification on whether fracture occurred in 10 years of follow-up. NOF high-risk is low bone mass (T score between −1.0 and −2.5 by femoral neck or spine BMD) and 10 year FRAX (including BMD) probability of fracture of ≥3% for hip and ≥20% for major osteoporotic fracture (MOF).(7) Proportions are illustrated for the whole cohort (n=4,464), as well as by a prior history of fracture (n=1505) or no prior fracture history (n=2,959).

