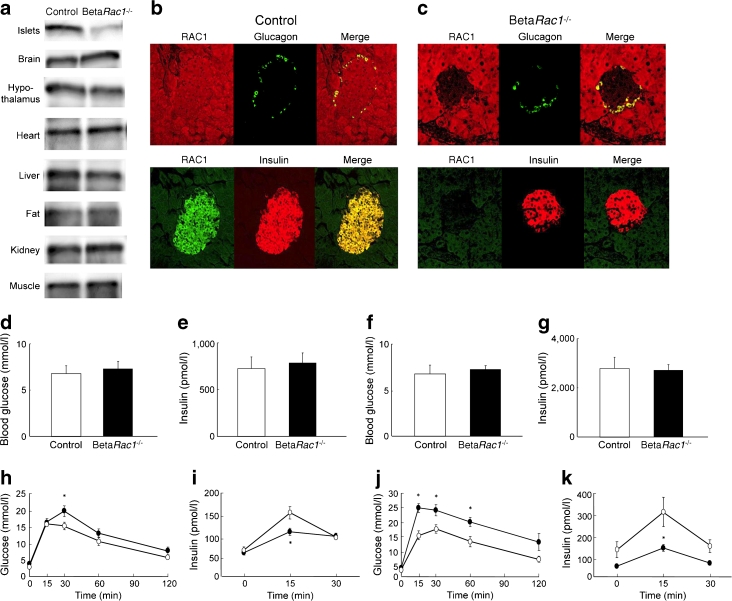
Fig. 1.
Generation of betaRac1 −/− mice and the effect of RAC1 ablation on glucose metabolism. (a) Immunoblot analysis of RAC1 in islets and in the brain, hypothalamus, heart, liver, fat, kidney and skeletal muscle of control and betaRac1 −/− mice. Immunostaining of pancreas sections of control (b) and betaRac1 −/− (c) mice with antibodies to RAC1, insulin and glucagon. (d–g) Blood glucose and plasma insulin concentrations for control (white bars) and betaRac1 −/− (black bars) mice fed normal chow (d, e) or a high-fat diet (f, g) at the age of 12 weeks. Graphs show the means ± SEM of at least ten control and betaRac1 −/− mice. (h–k) Blood glucose (h, j) and plasma insulin (i, k) concentrations during OGTT are shown for control (n = 6) and betaRac1 −/− (n = 6) mice fed a normal diet (h, i) or a high-fat diet (j, k). * p < 0.05 vs the corresponding value for control mice

